Clinical Data Lab / Figure Library
Figures with purpose.
Details you can trust.
One library, from descriptive profiles to missingness and adjusted comparisons. Choose a clinical question, inspect the executed results, then review the method and evidence.
Missingness, distributions & treatment contrasts
Five analysis cases with population-specific results, explicit denominators and reproducible R/Python calculations. Start with completeness before comparing outcomes.
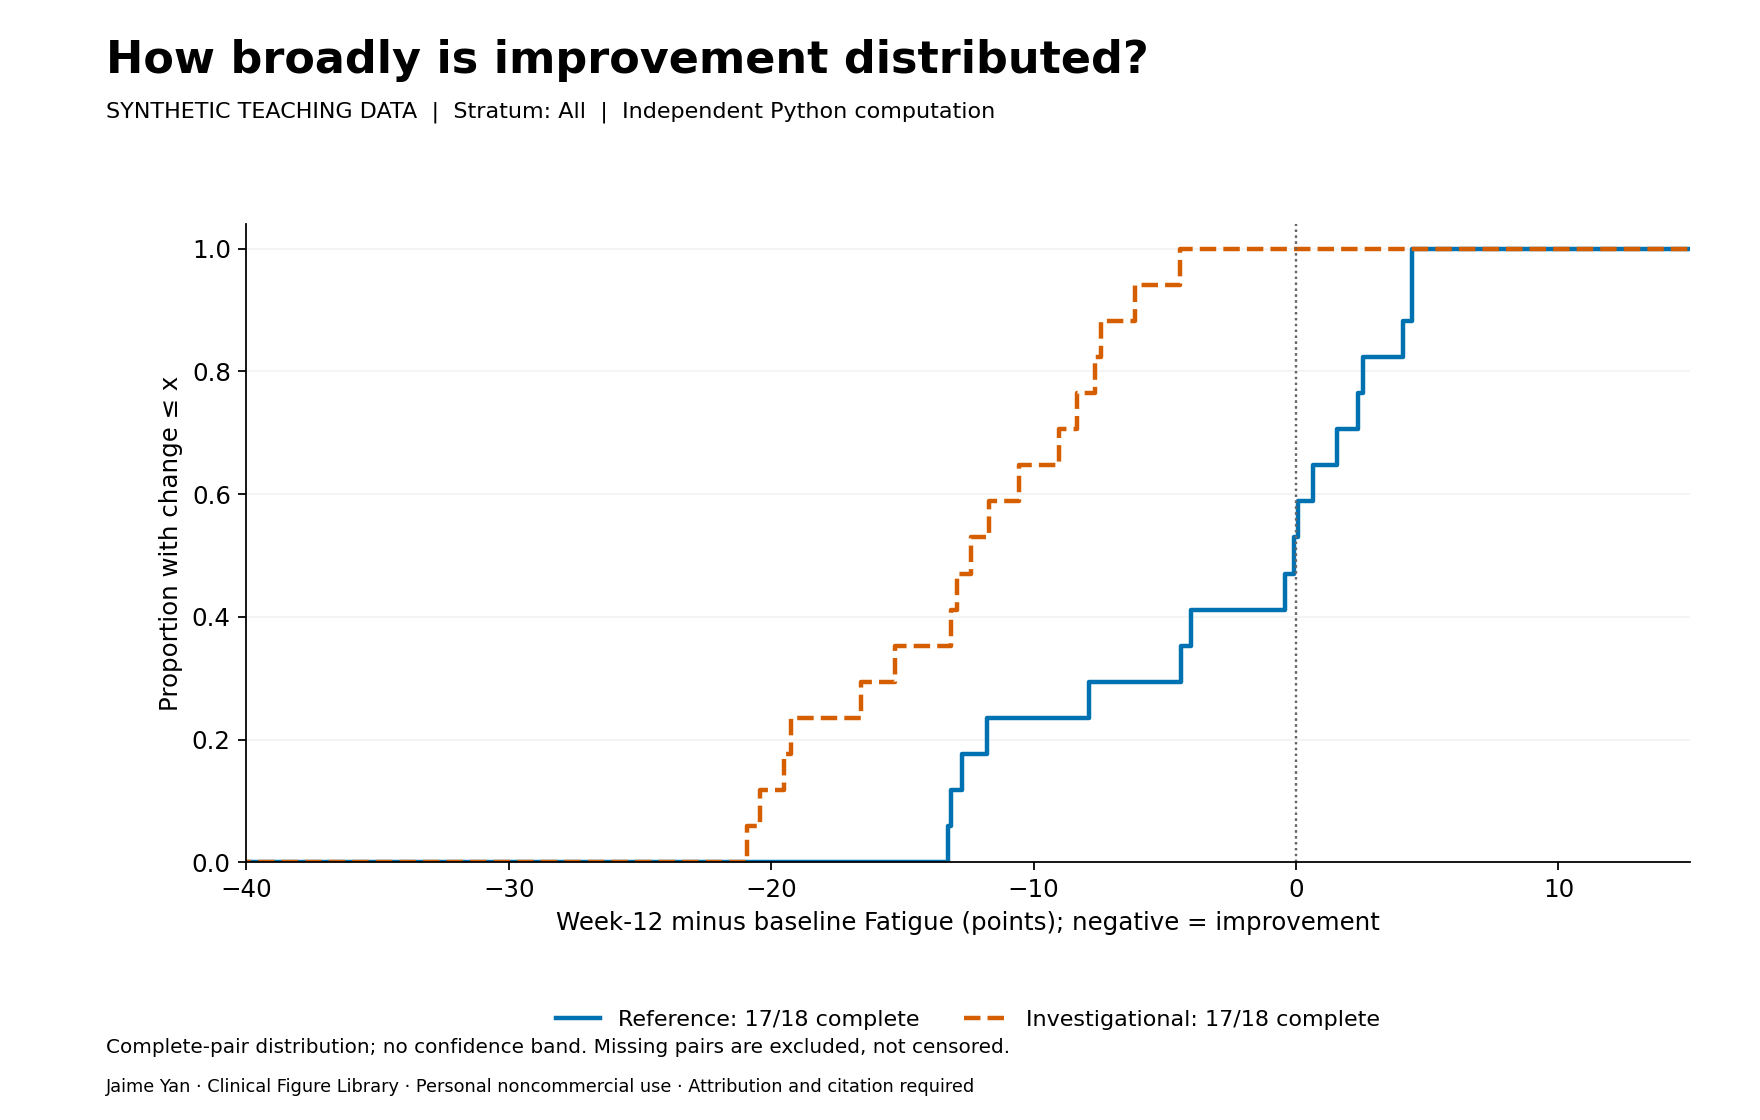
Distribution of symptom change
Is the observed improvement broadly distributed, or concentrated in a few participants?
Descriptive analysis · Independent R + Python · Synthetic data
Review results, methods & evidence →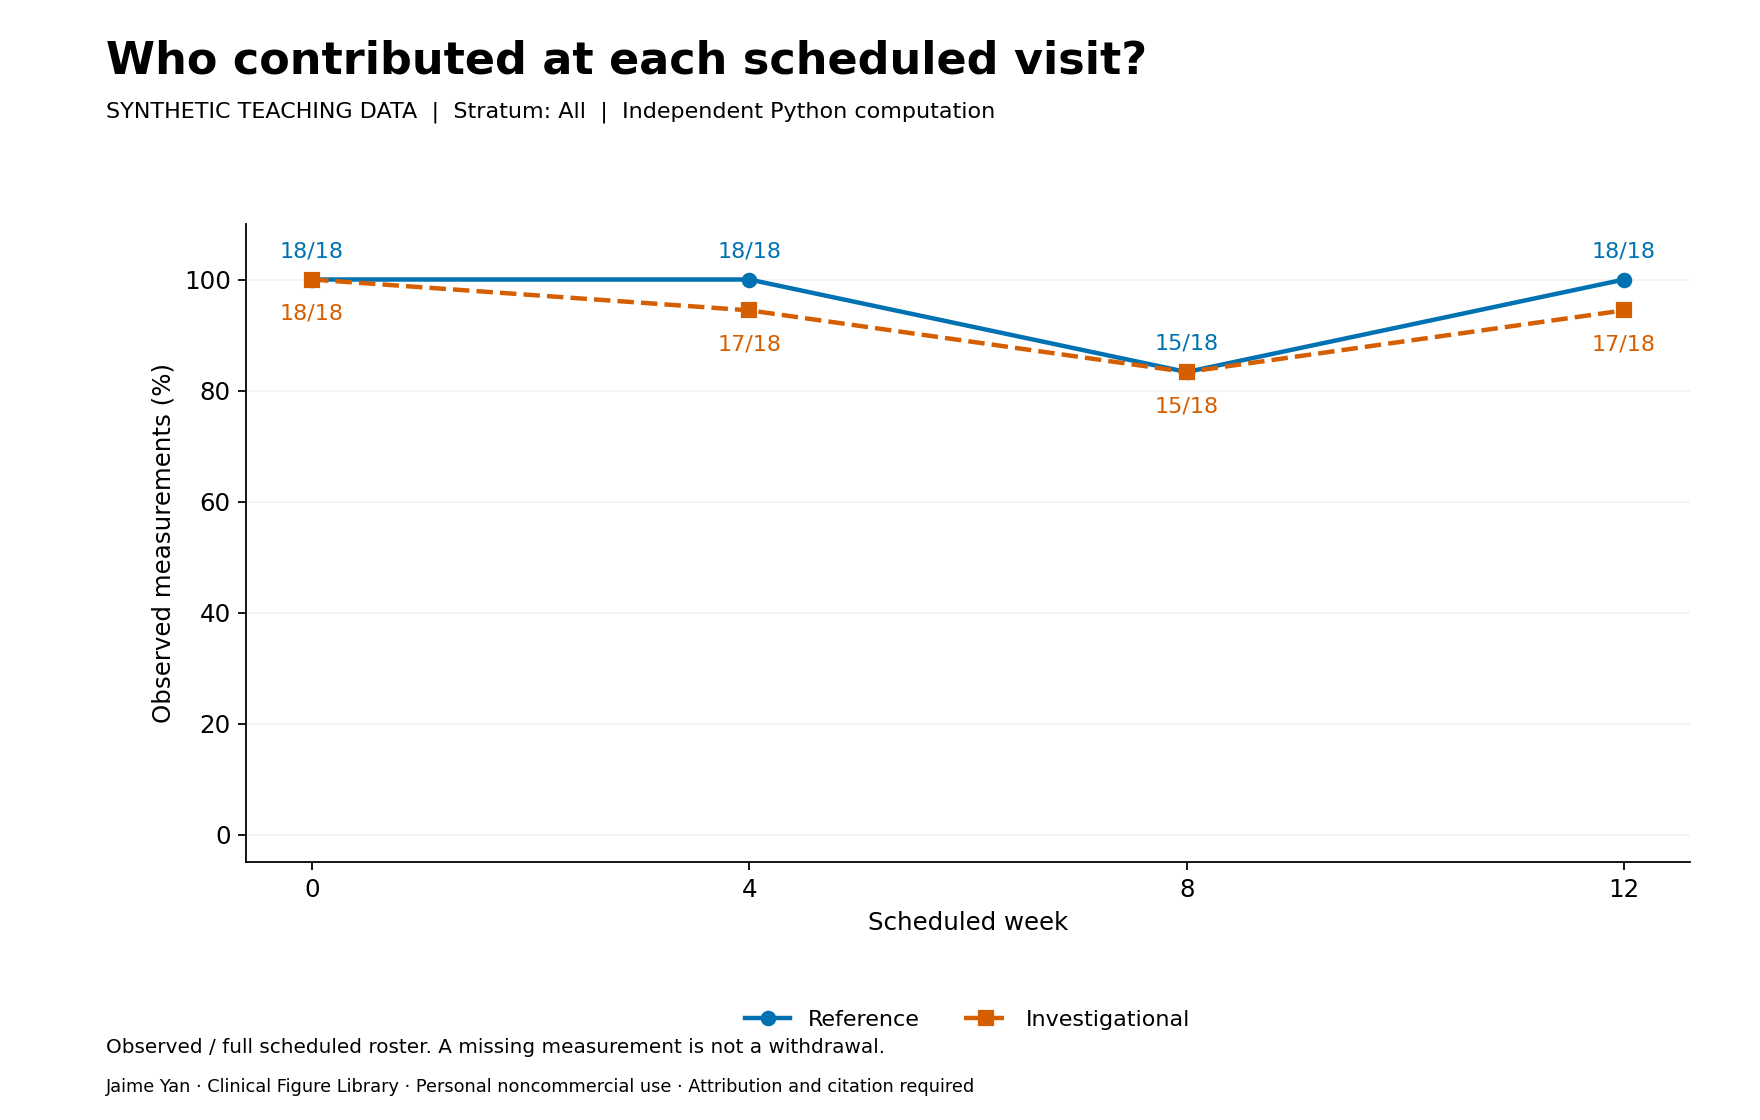
Scheduled measurement completeness
How much of the scheduled population contributes at each visit?
Descriptive analysis · Independent R + Python · Synthetic data
Review results, methods & evidence →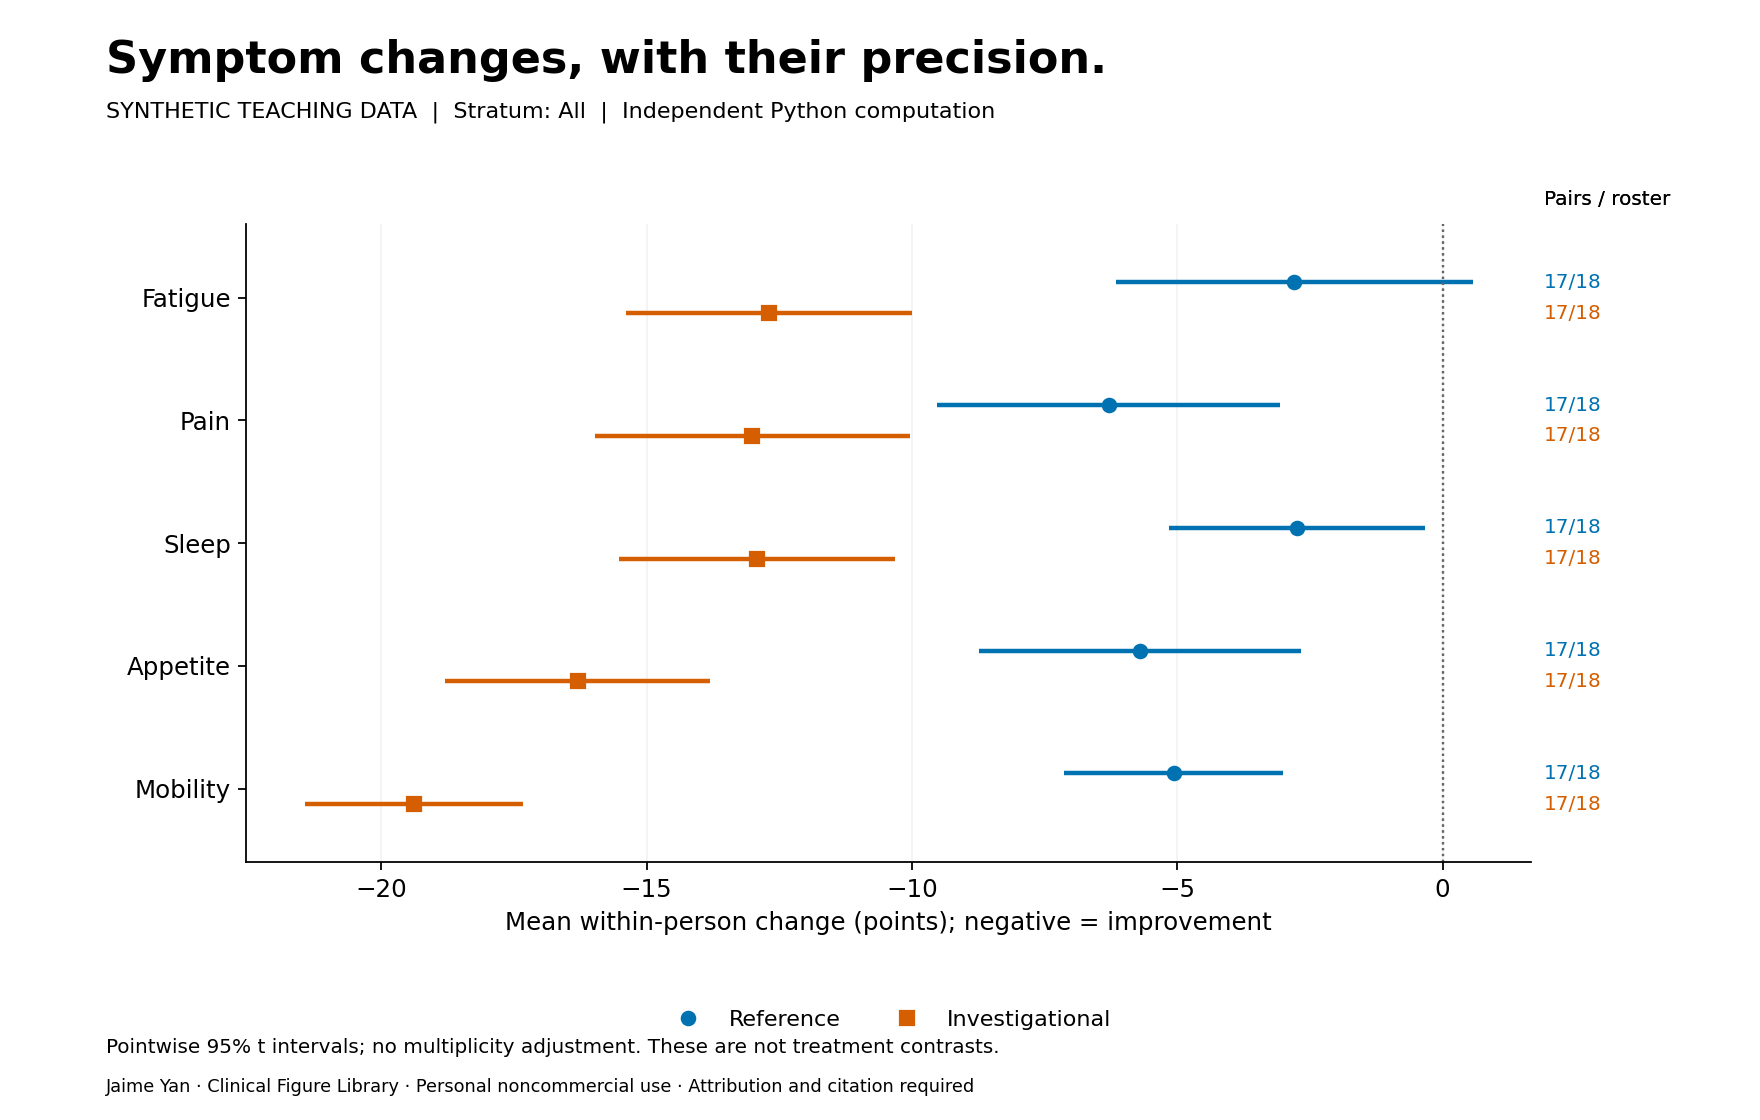
Symptom changes with uncertainty
How large are the observed changes in each domain, and how precisely are their means estimated?
Descriptive analysis · Independent R + Python · Synthetic data
Review results, methods & evidence →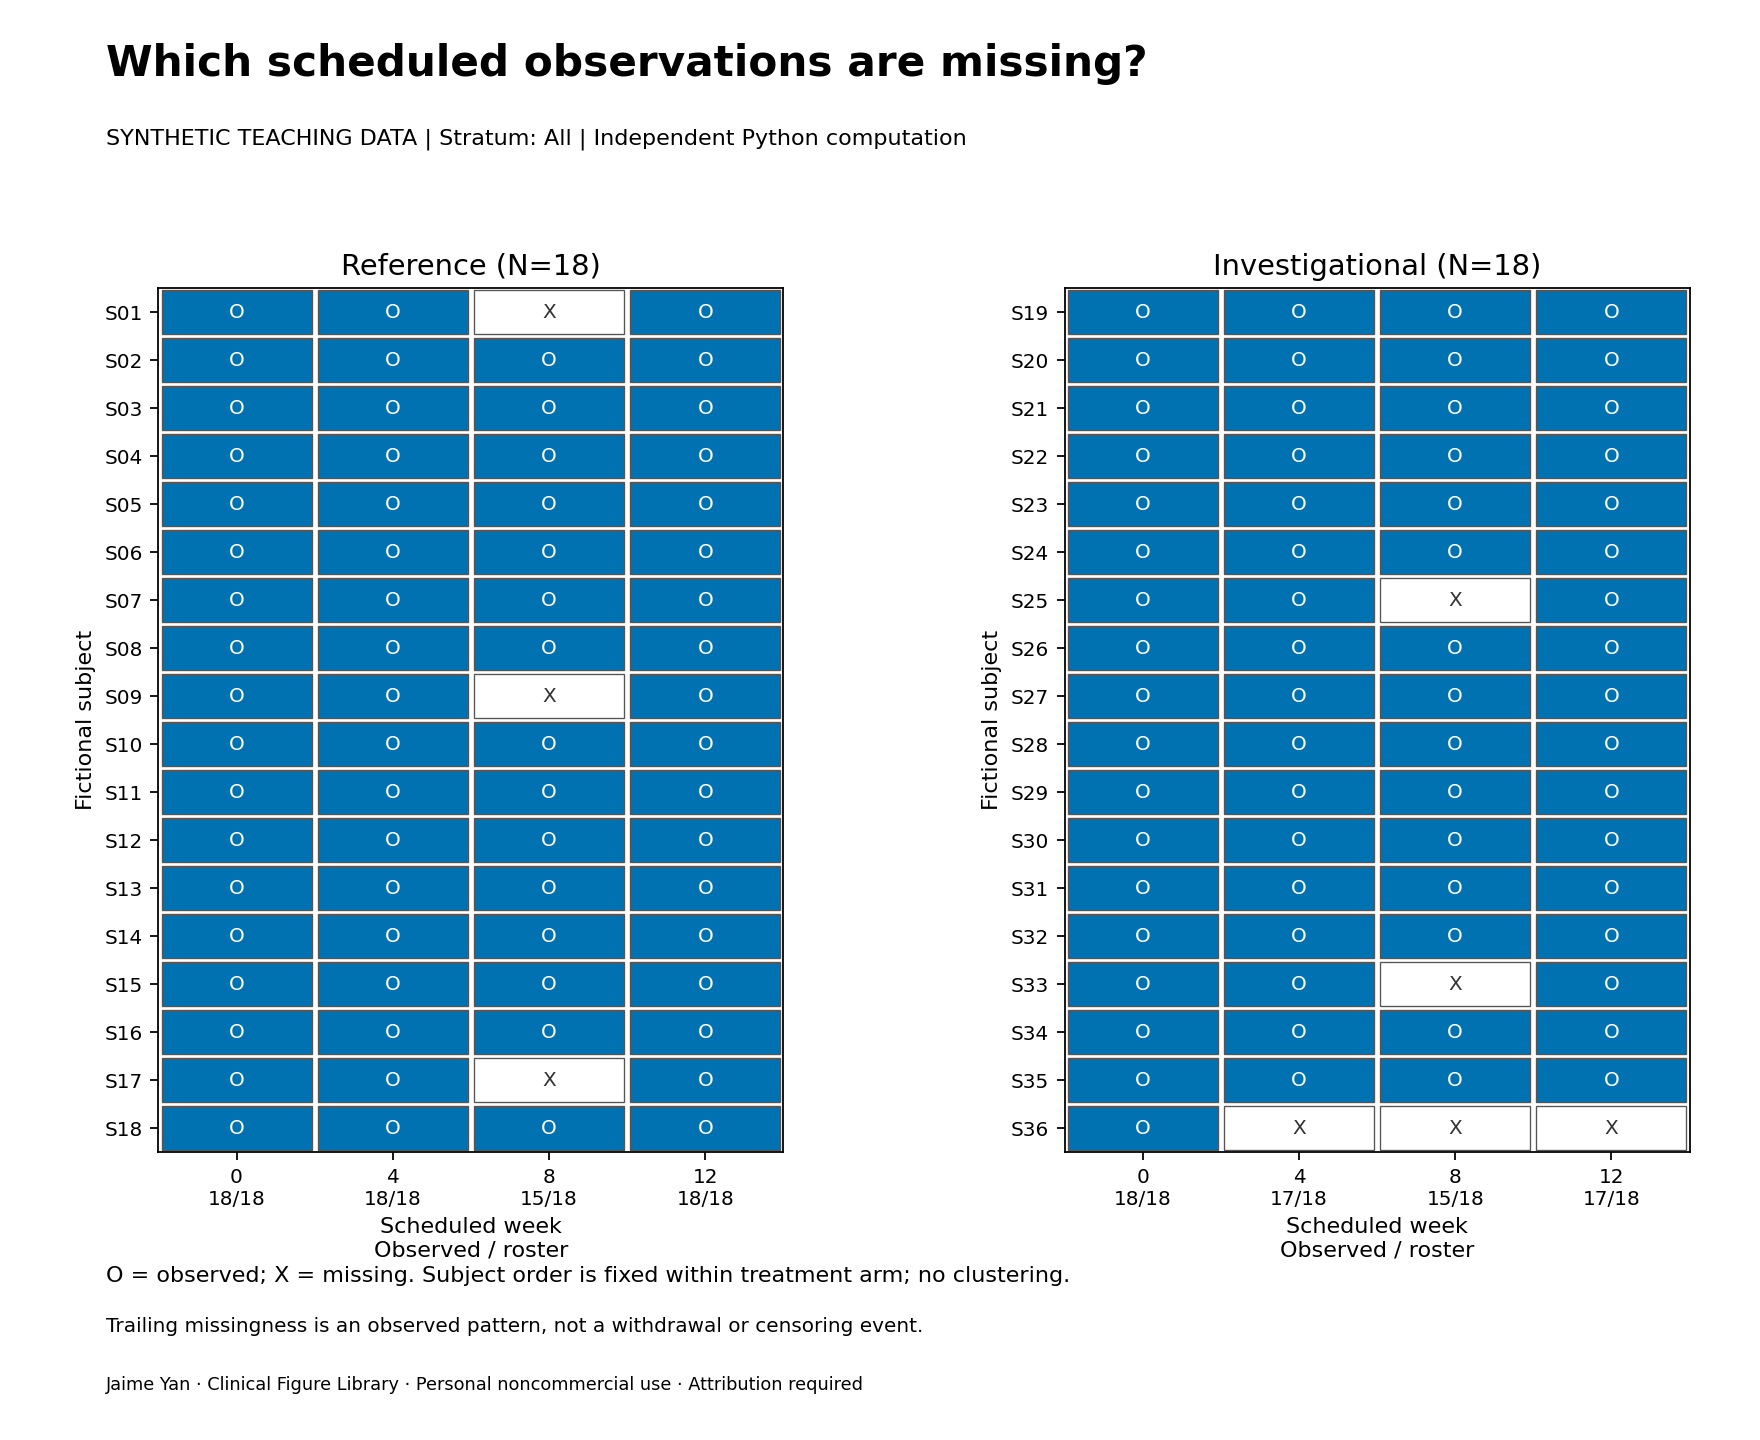
Subject-by-visit observation matrix
Are missing assessments isolated gaps or trailing runs within individual participants?
Descriptive analysis · Independent R + Python · Synthetic data
Review results, methods & evidence →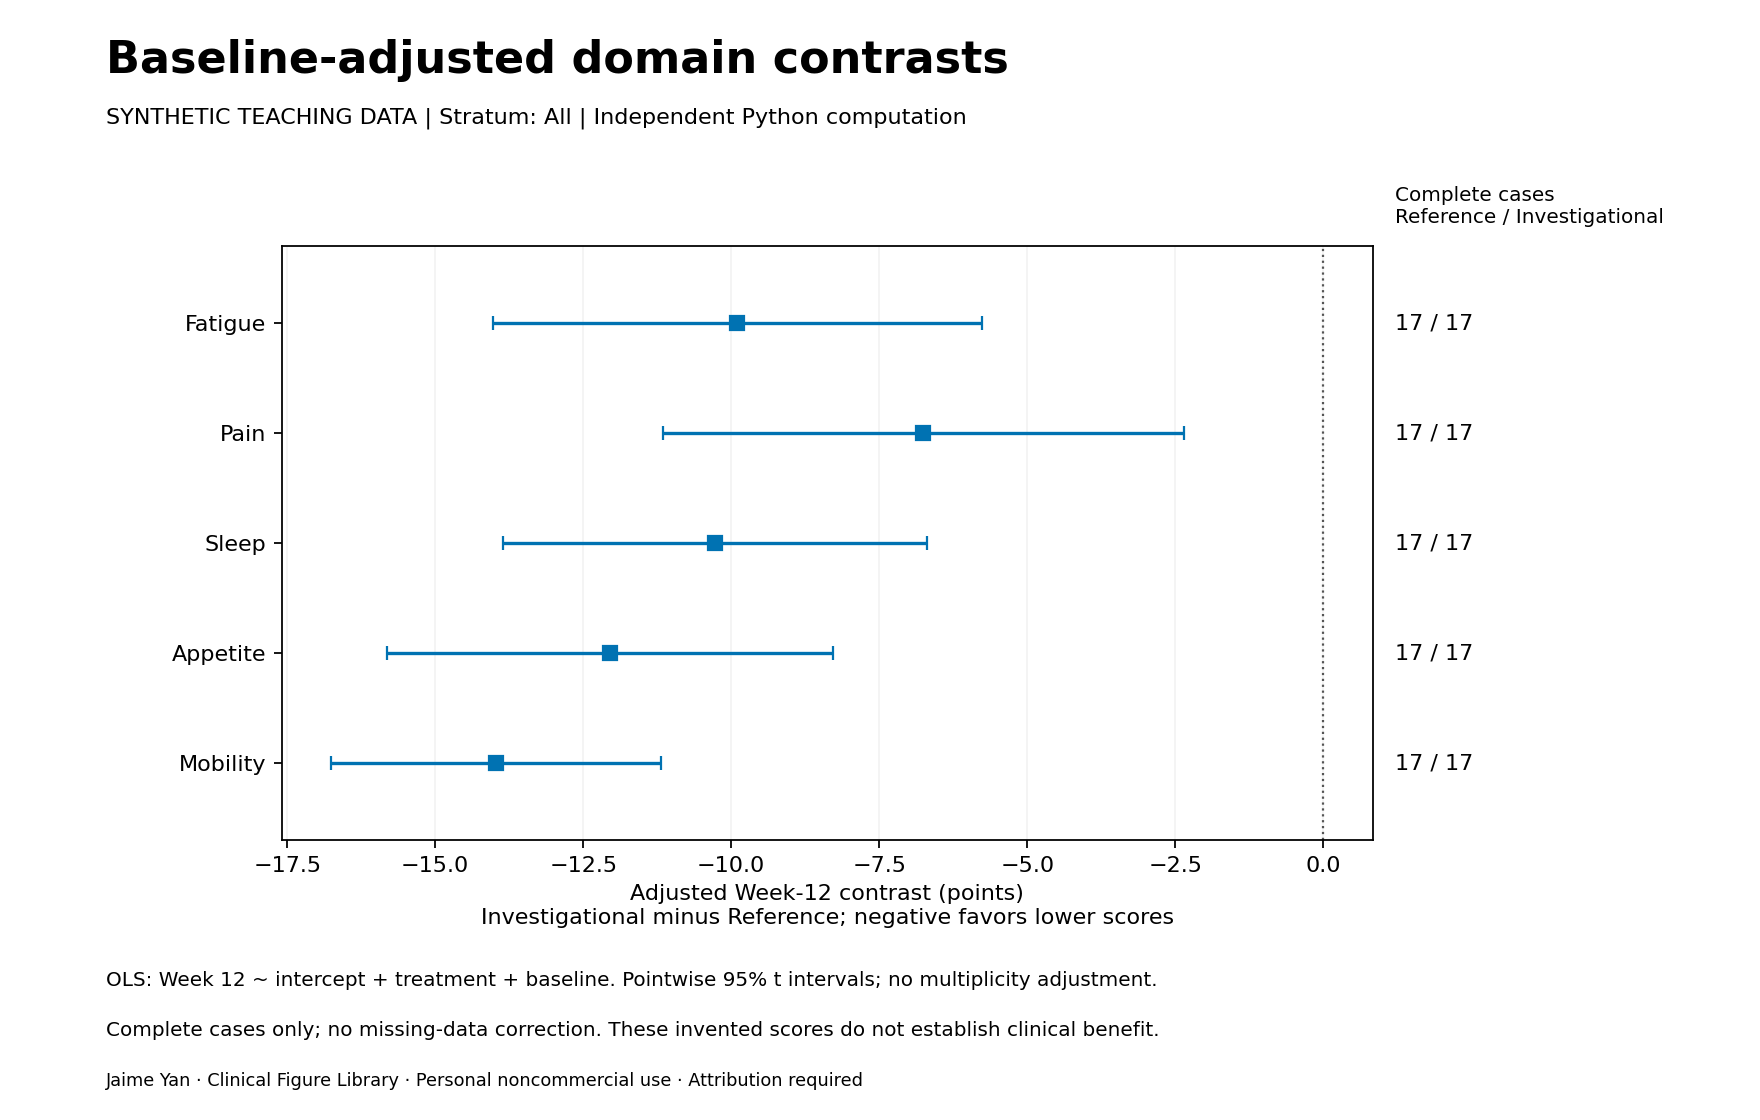
Baseline-adjusted domain contrasts
What is the fitted between-arm Week-12 difference after adjusting for baseline within complete cases?
Model-based complete-case contrast · Independent R + Python · Synthetic data
Review results, methods & evidence →Six foundational figure templates
Profiles, trajectories and effect summaries. These use the full example population; table search changes displayed rows only. Open a template for its interpretation limits.
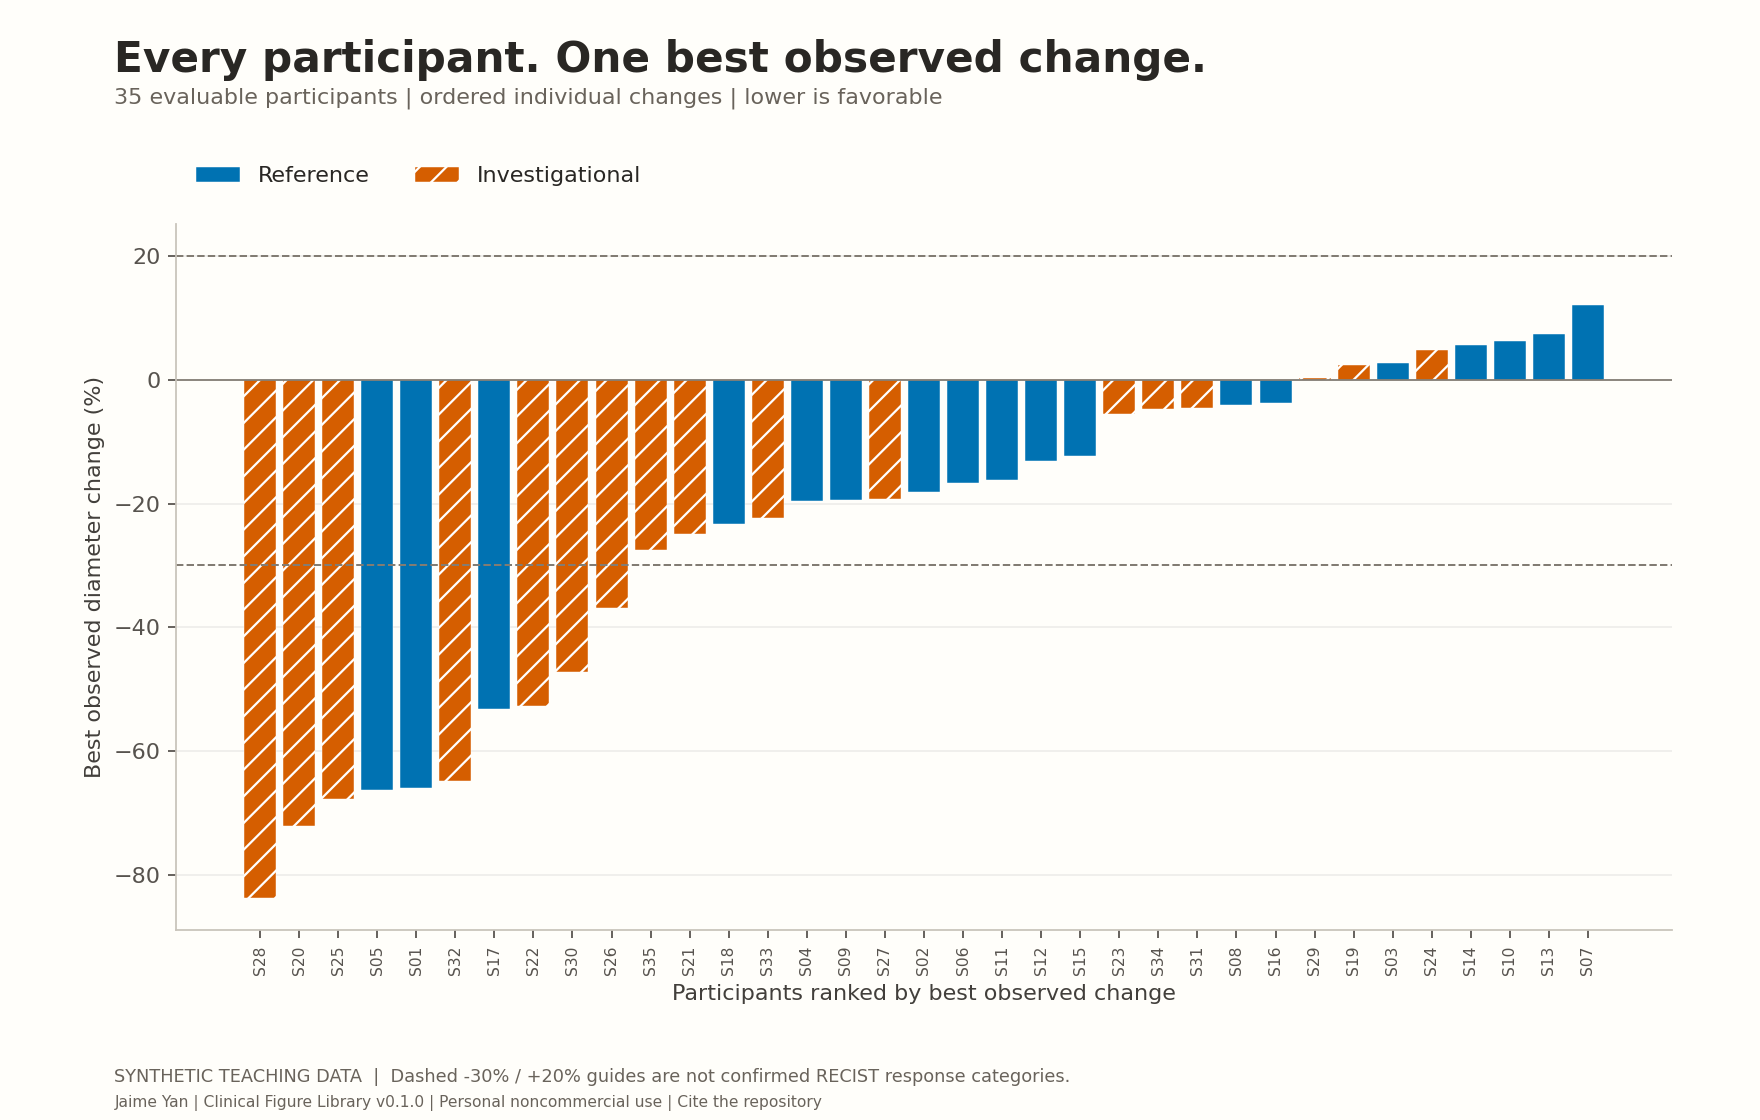
Waterfall
An ordered view of individual change, with transparent eligibility and reference guides.
Explore template →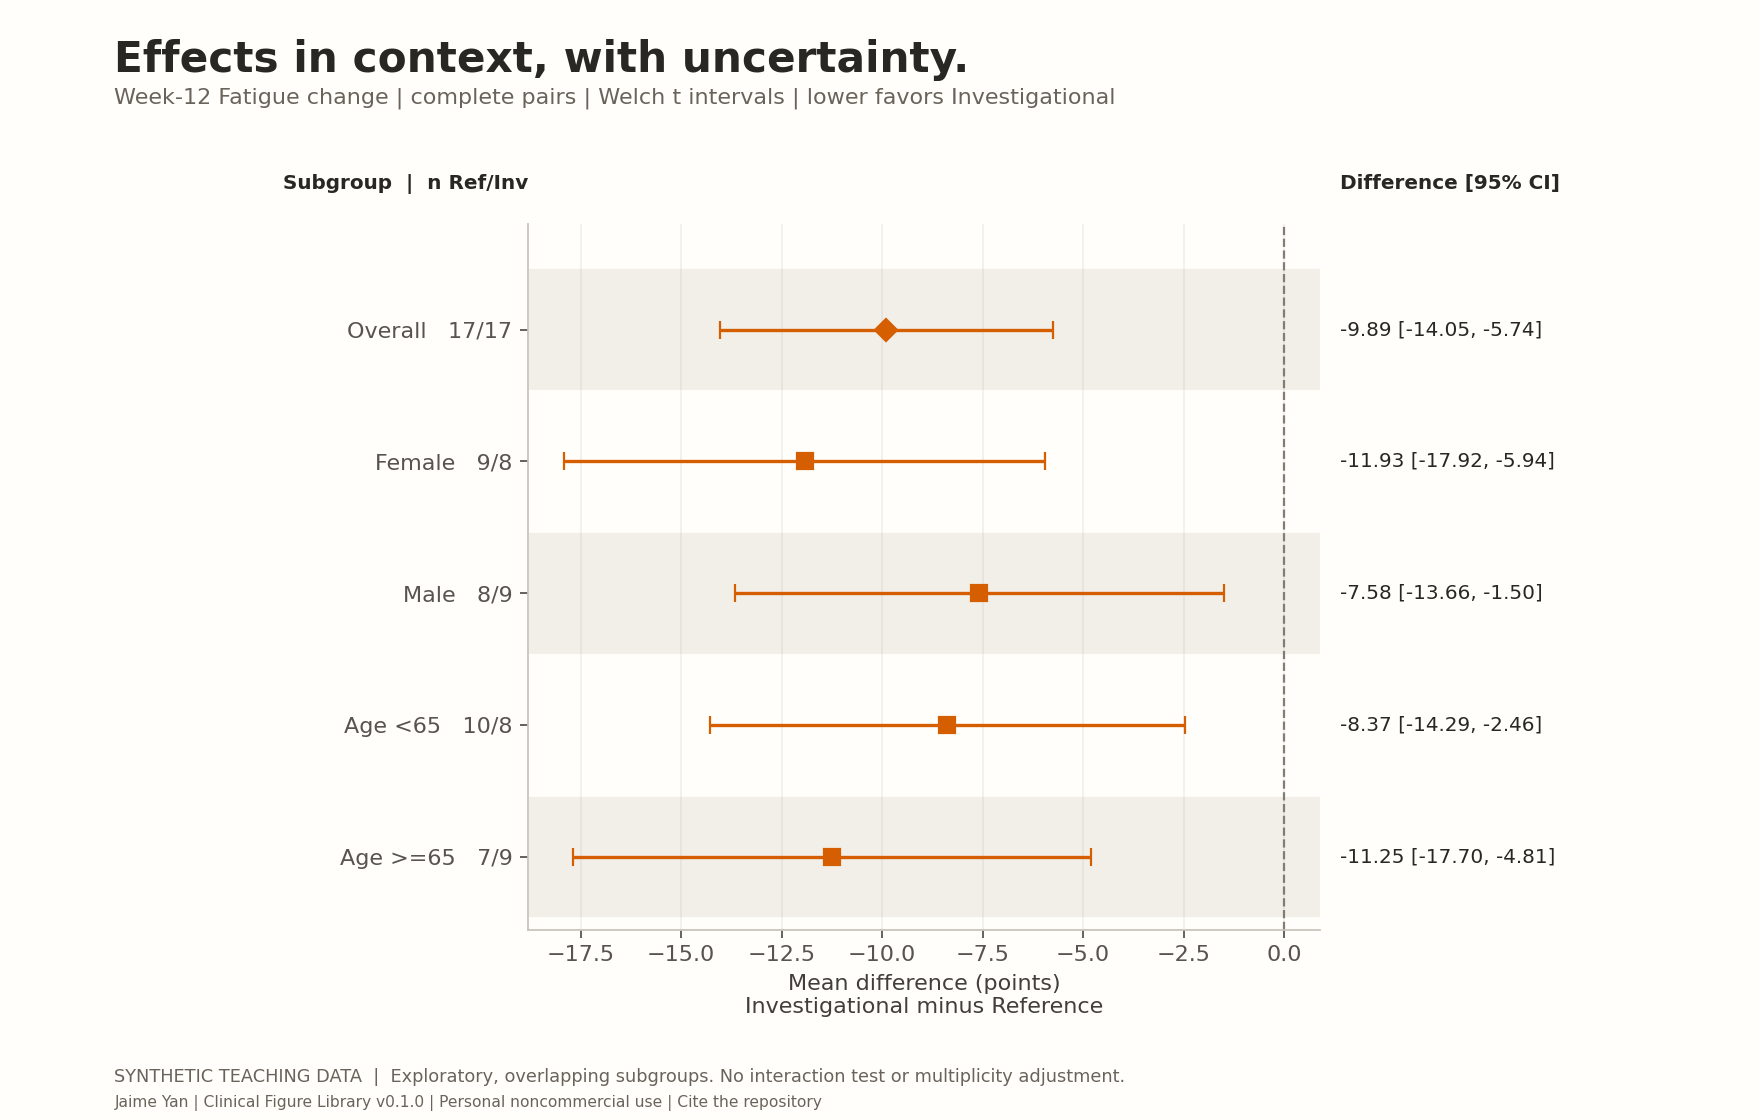
Forest
Aligned subgroup sizes and confidence intervals make the estimate easy to inspect.
Explore template →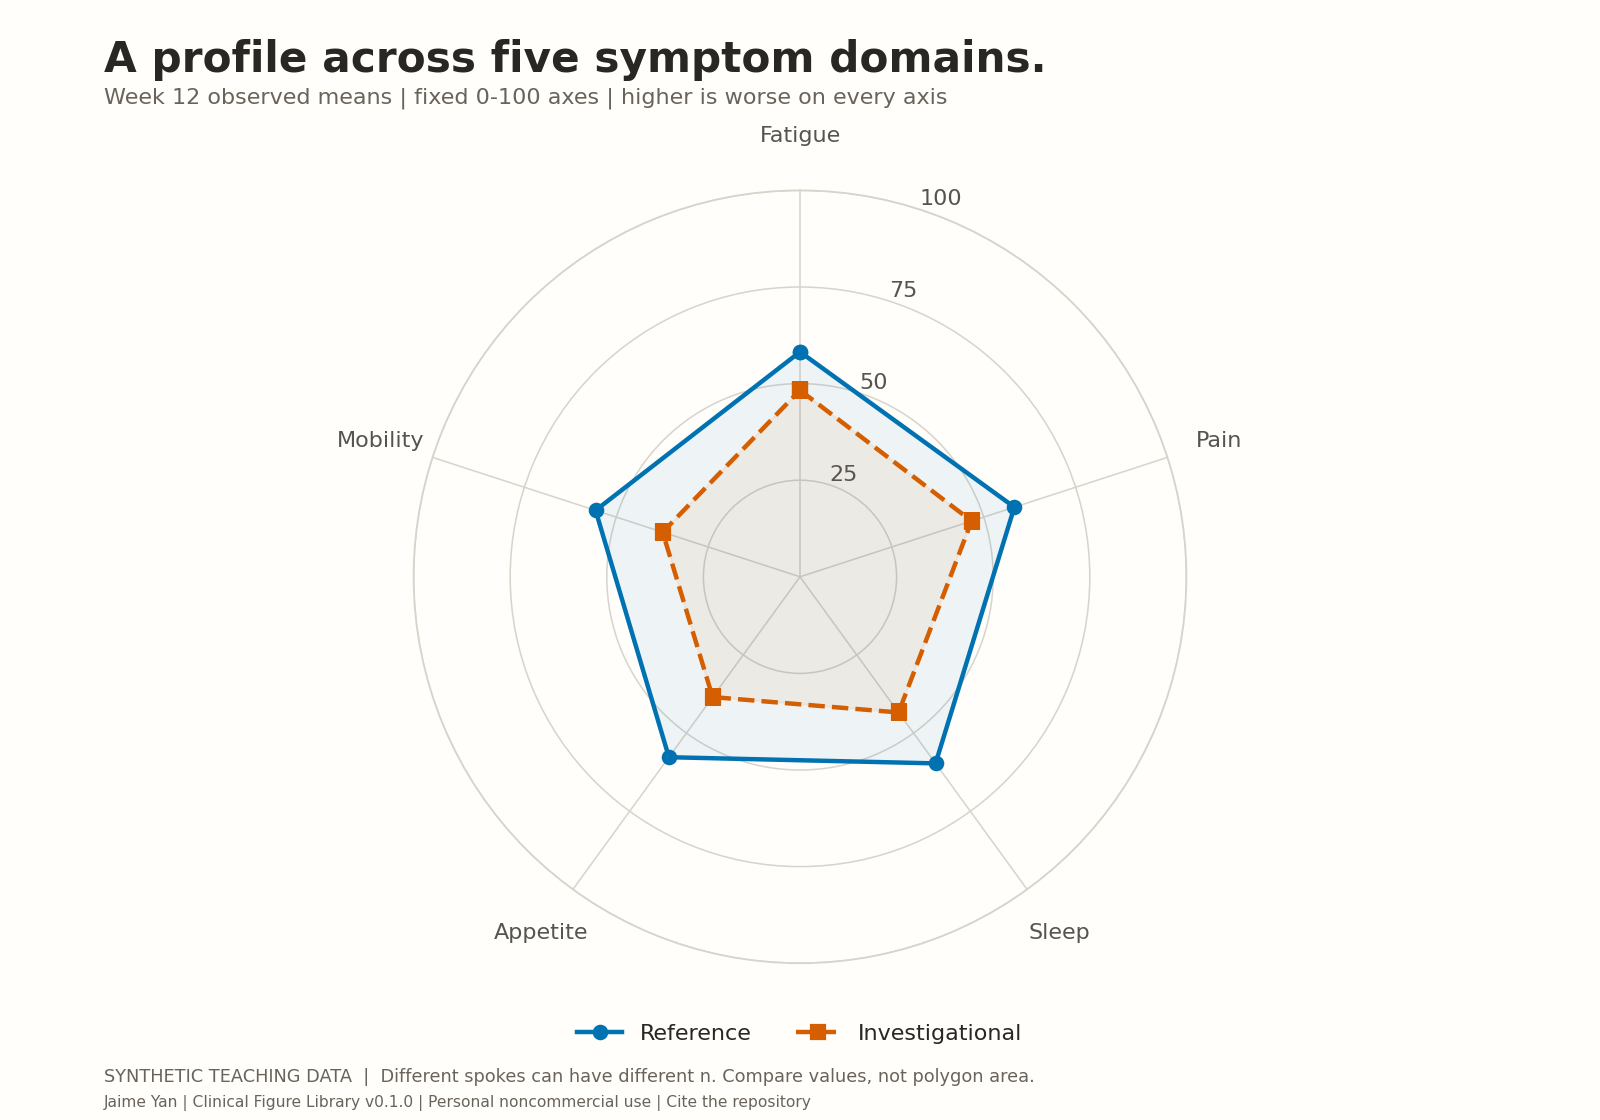
Radar
A fixed scale and common direction keep the profile interpretable.
Explore template →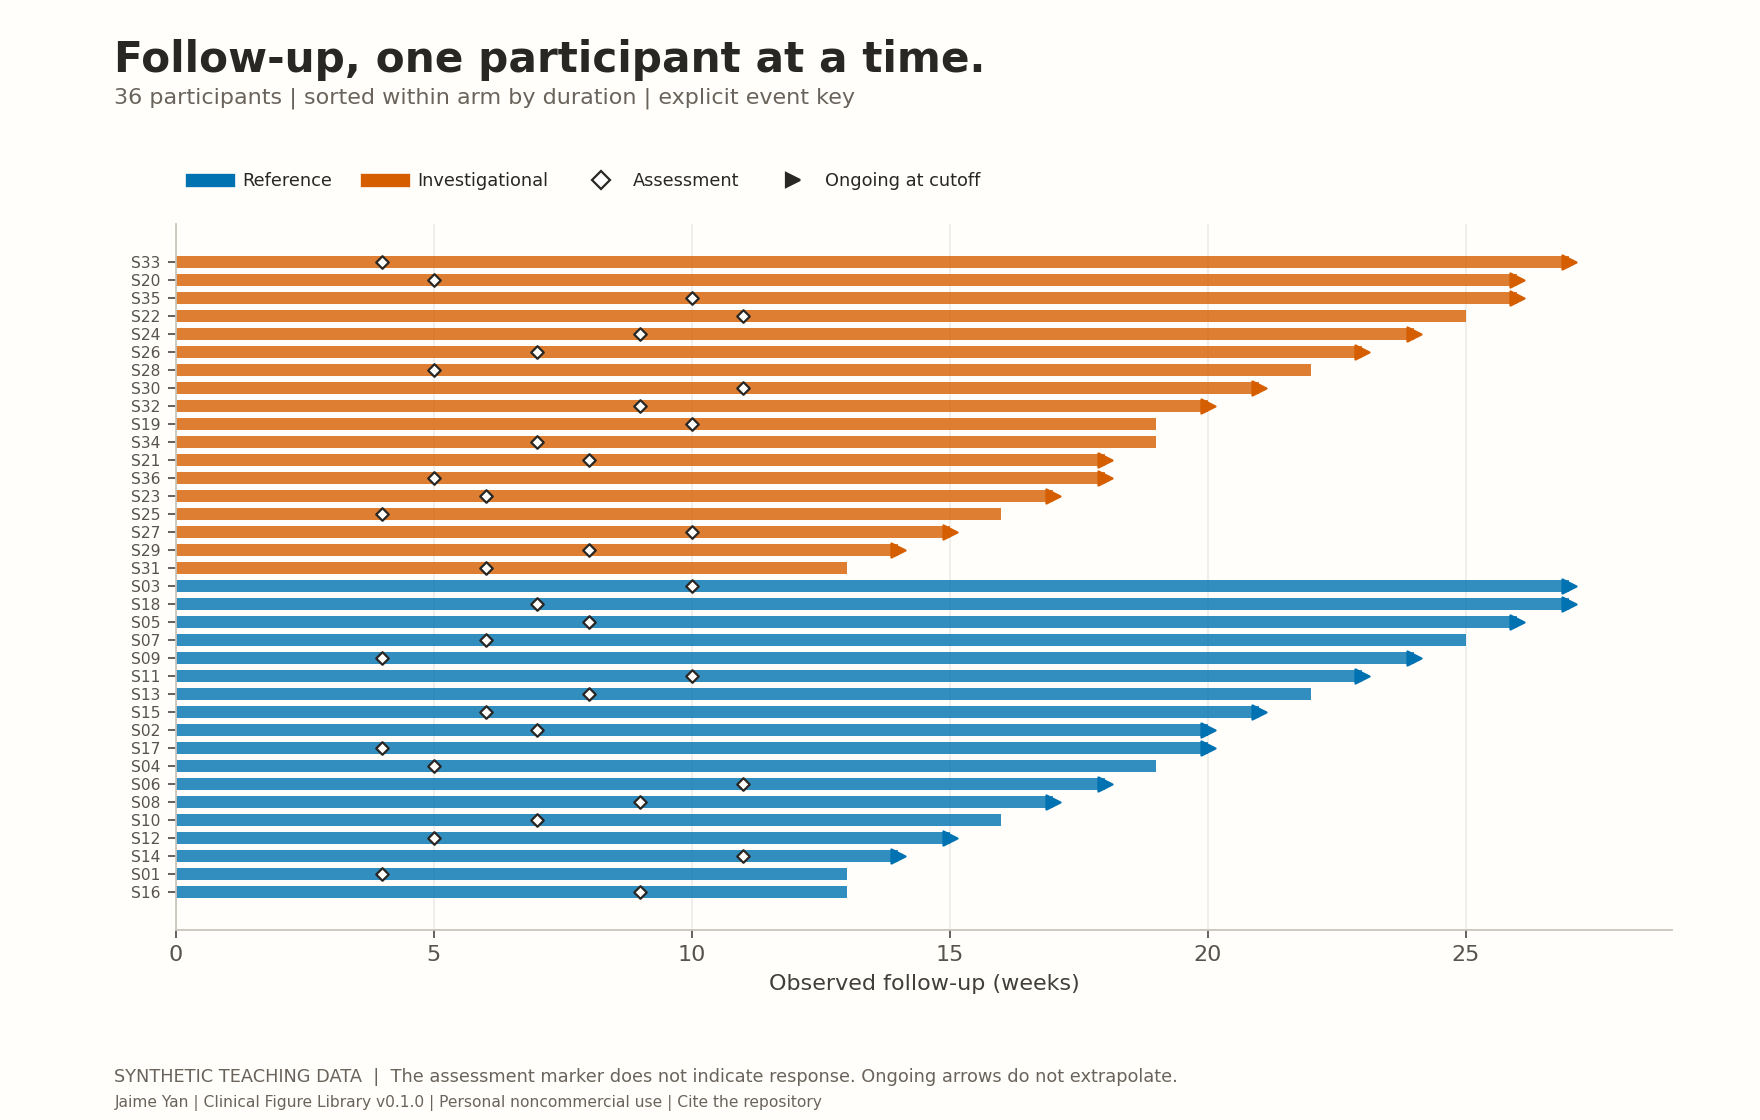
Swimmer
Duration, assessment and ongoing follow-up have distinct visual marks.
Explore template →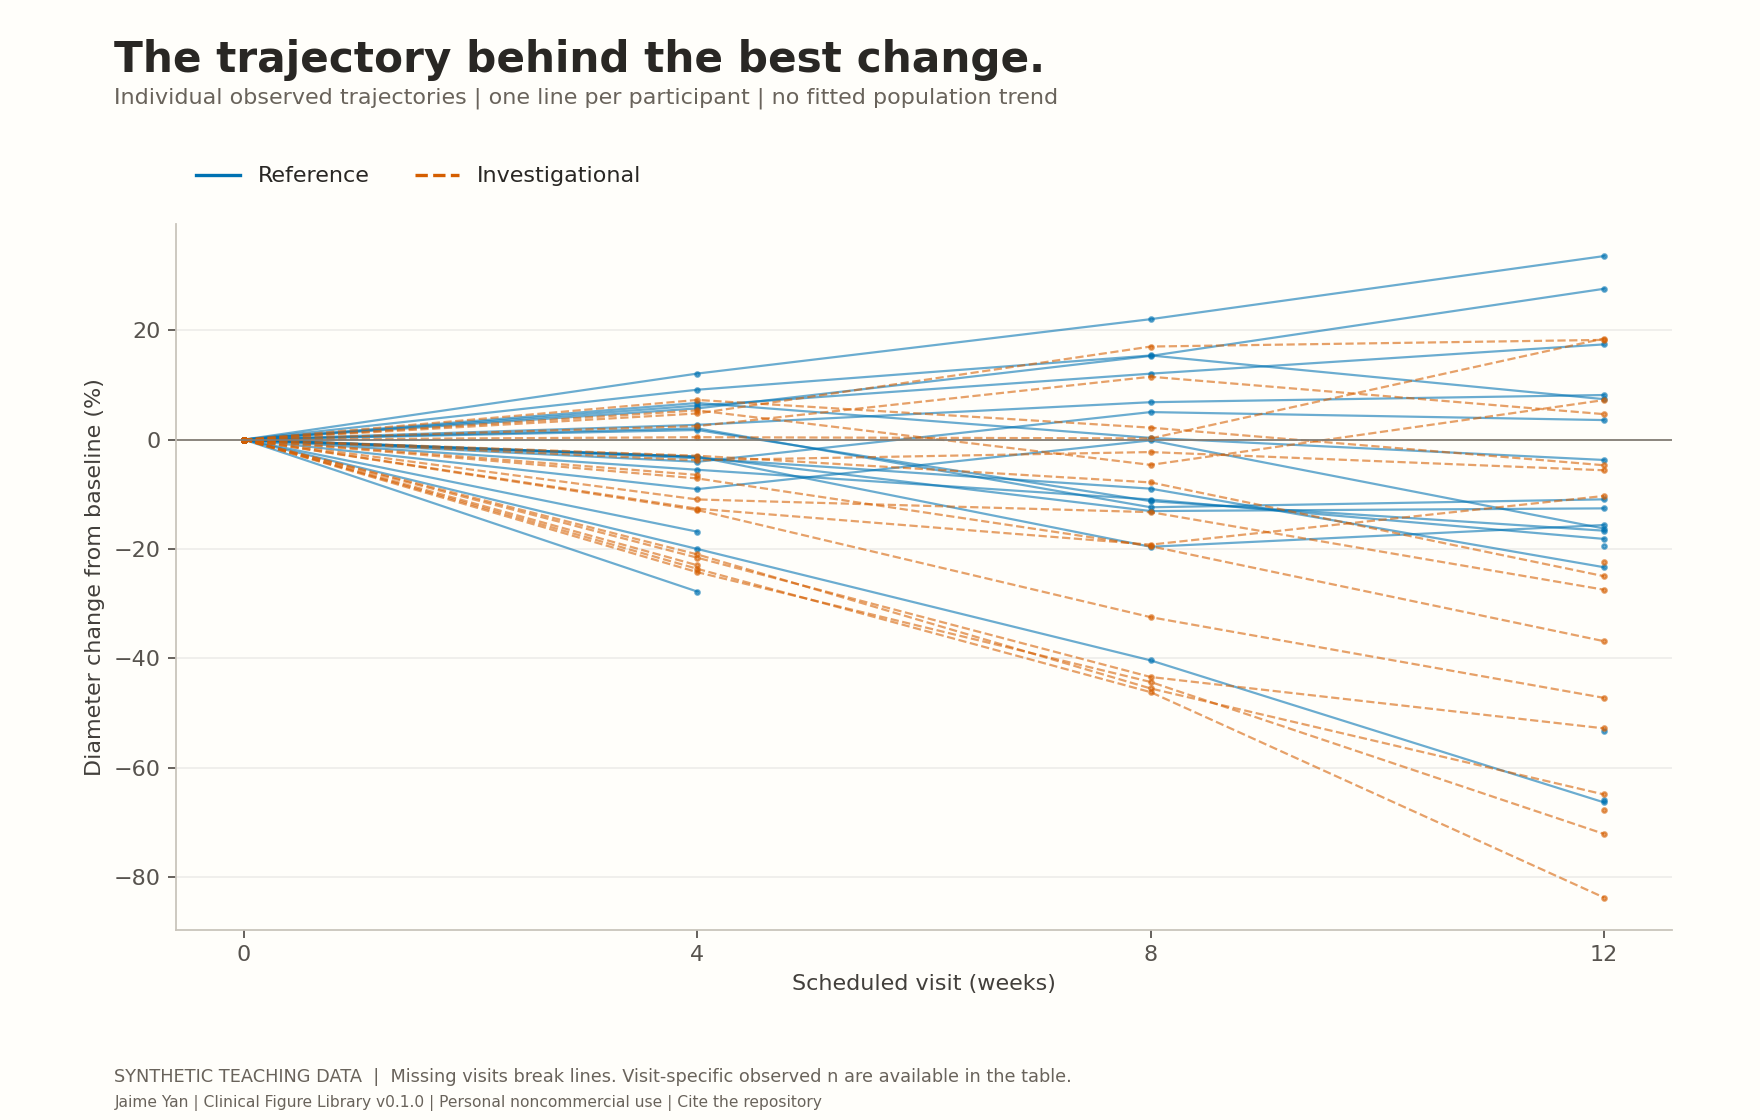
Spider
Individual trajectories preserve timing and show gaps at missed visits.
Explore template →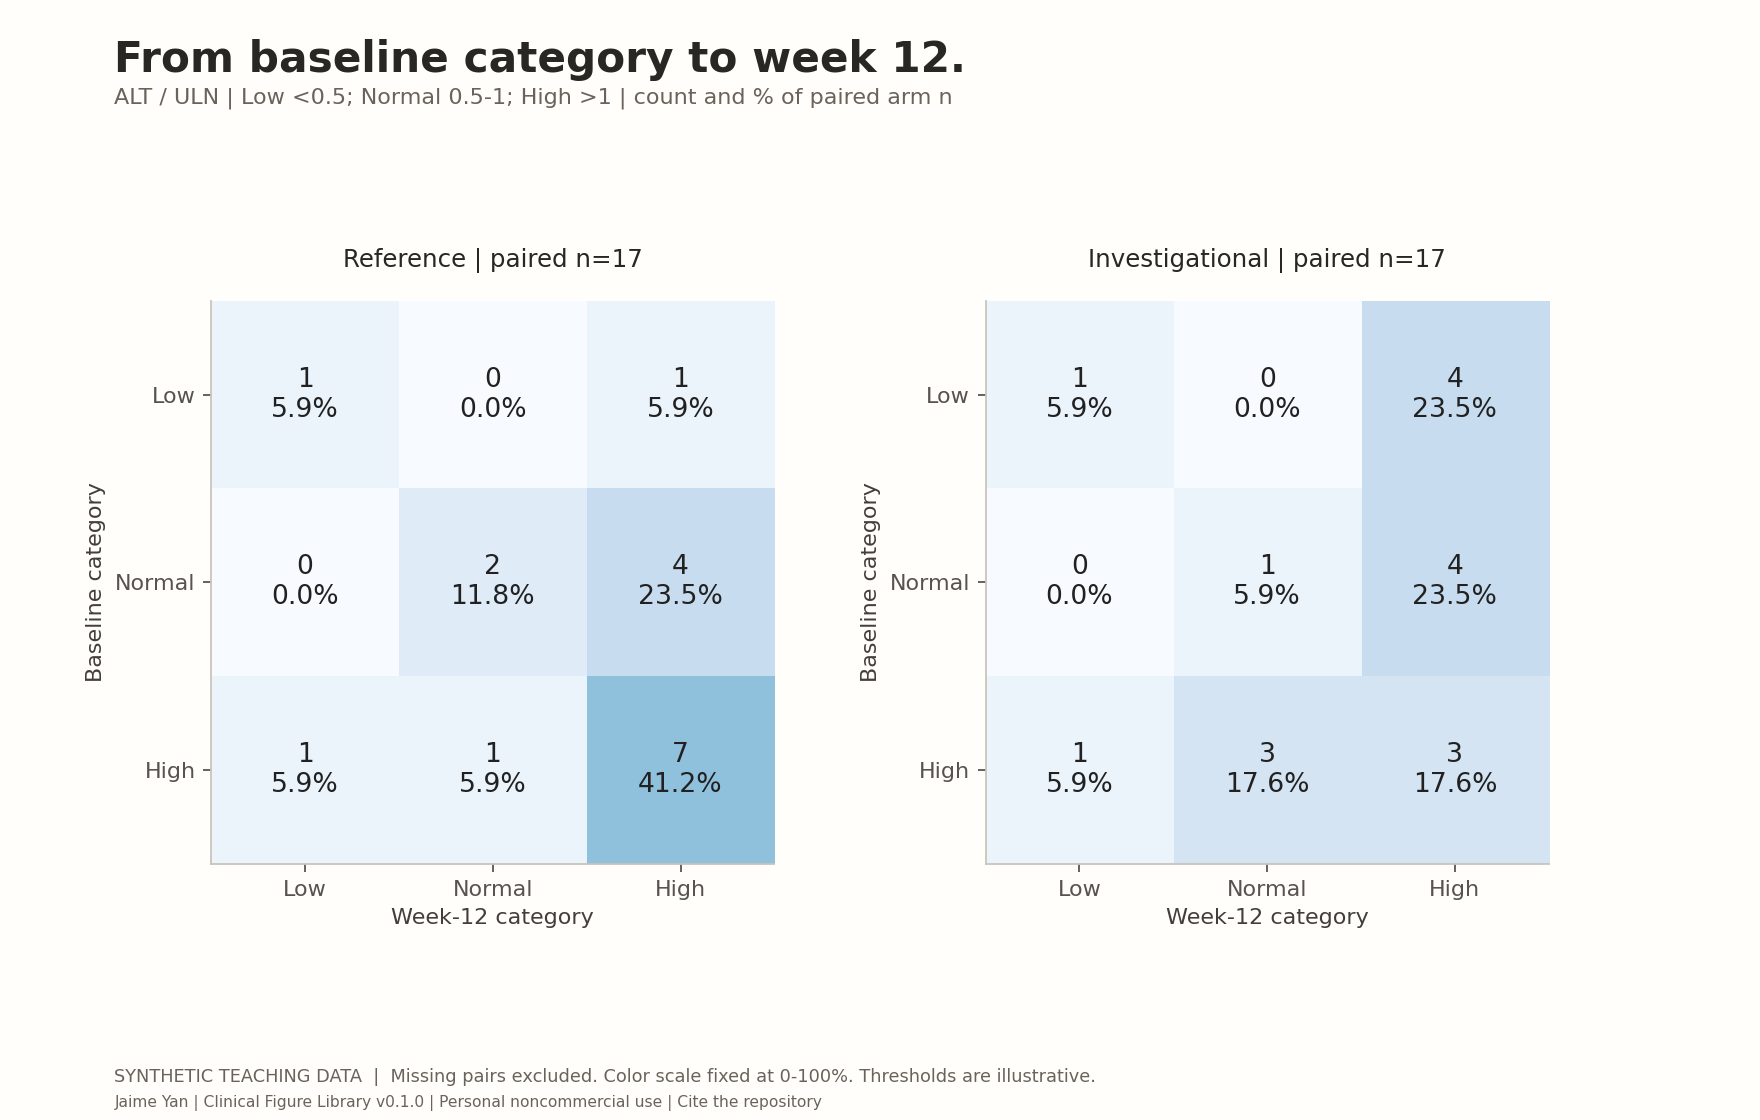
Laboratory shift
A complete nine-cell matrix shows counts and their actual paired denominator.
Explore template →Built to inspect & reuse
Review each case with its analysis contract.
Each case provides independent R and Python calculations from the same fictional input files. The five analysis cases and six foundational figures have separate source bundles and QC records, linked on their case pages. The templates return editable ggplot or Matplotlib objects, with SVG, PNG and PDF exports. The website switches between precomputed renders; it does not execute code.
Clinical meaning first
Fixed scales, observed denominators, explicit missingness and methods. No implied RECIST classification or validated clinical instrument.
Established foundations
Built on installed ggplot2 and Matplotlib. Design references include tern and forestplot. No additional package installation or runtime CDN.
Evidence, not badges
Independent numerical comparison, known-answer fixtures and artifact hashes. Existing package-risk QC remains not run; it is distinct from analysis verification.
Original author: Jaime Yan. Personal noncommercial use only; business use requires separate written permission. Attribution and citation are required. Read the license and cite this work. These synthetic examples are separate from the CDISC Pilot case studies.