Figure Library / Learning paths
Denominators over time · Synthetic teaching data
Scheduled measurement completeness
How much of the scheduled population contributes at each visit?
Makes the changing denominators behind the existing spider plot explicit; no outcome values are excluded to improve appearance.
Explore the executed results
Selection switches exact precomputed results. It changes the figure, denominators, table, summary and current-selection downloads together. No analysis runs in this browser.
Python · All participants · 8 computed rows. Review population counts and exact values in the table below.
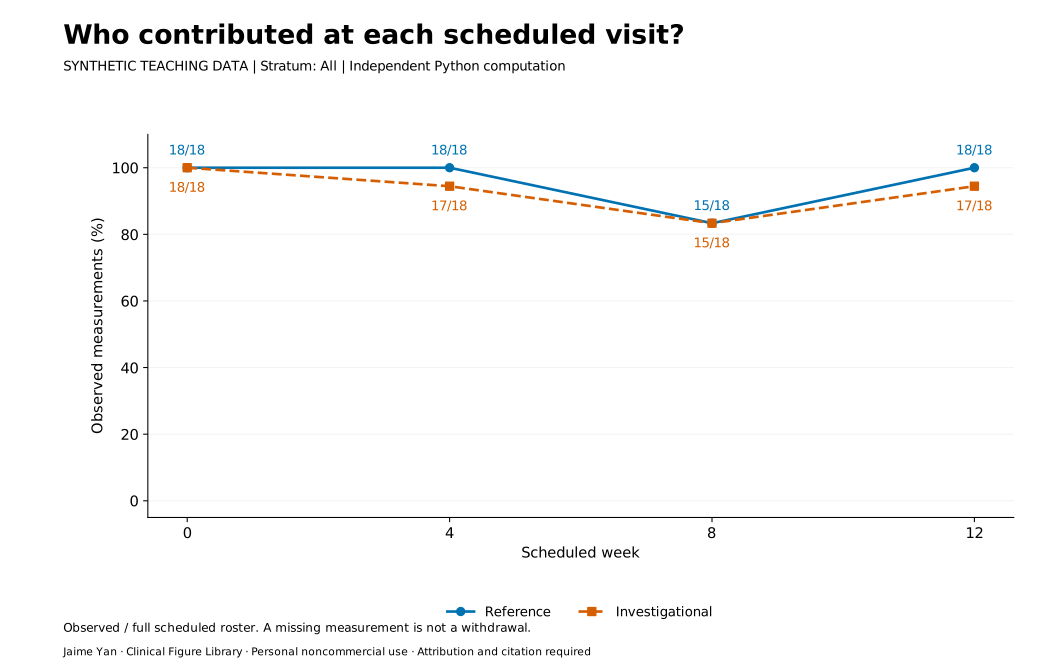
Image unavailable. Use the numerical table and downloads below.
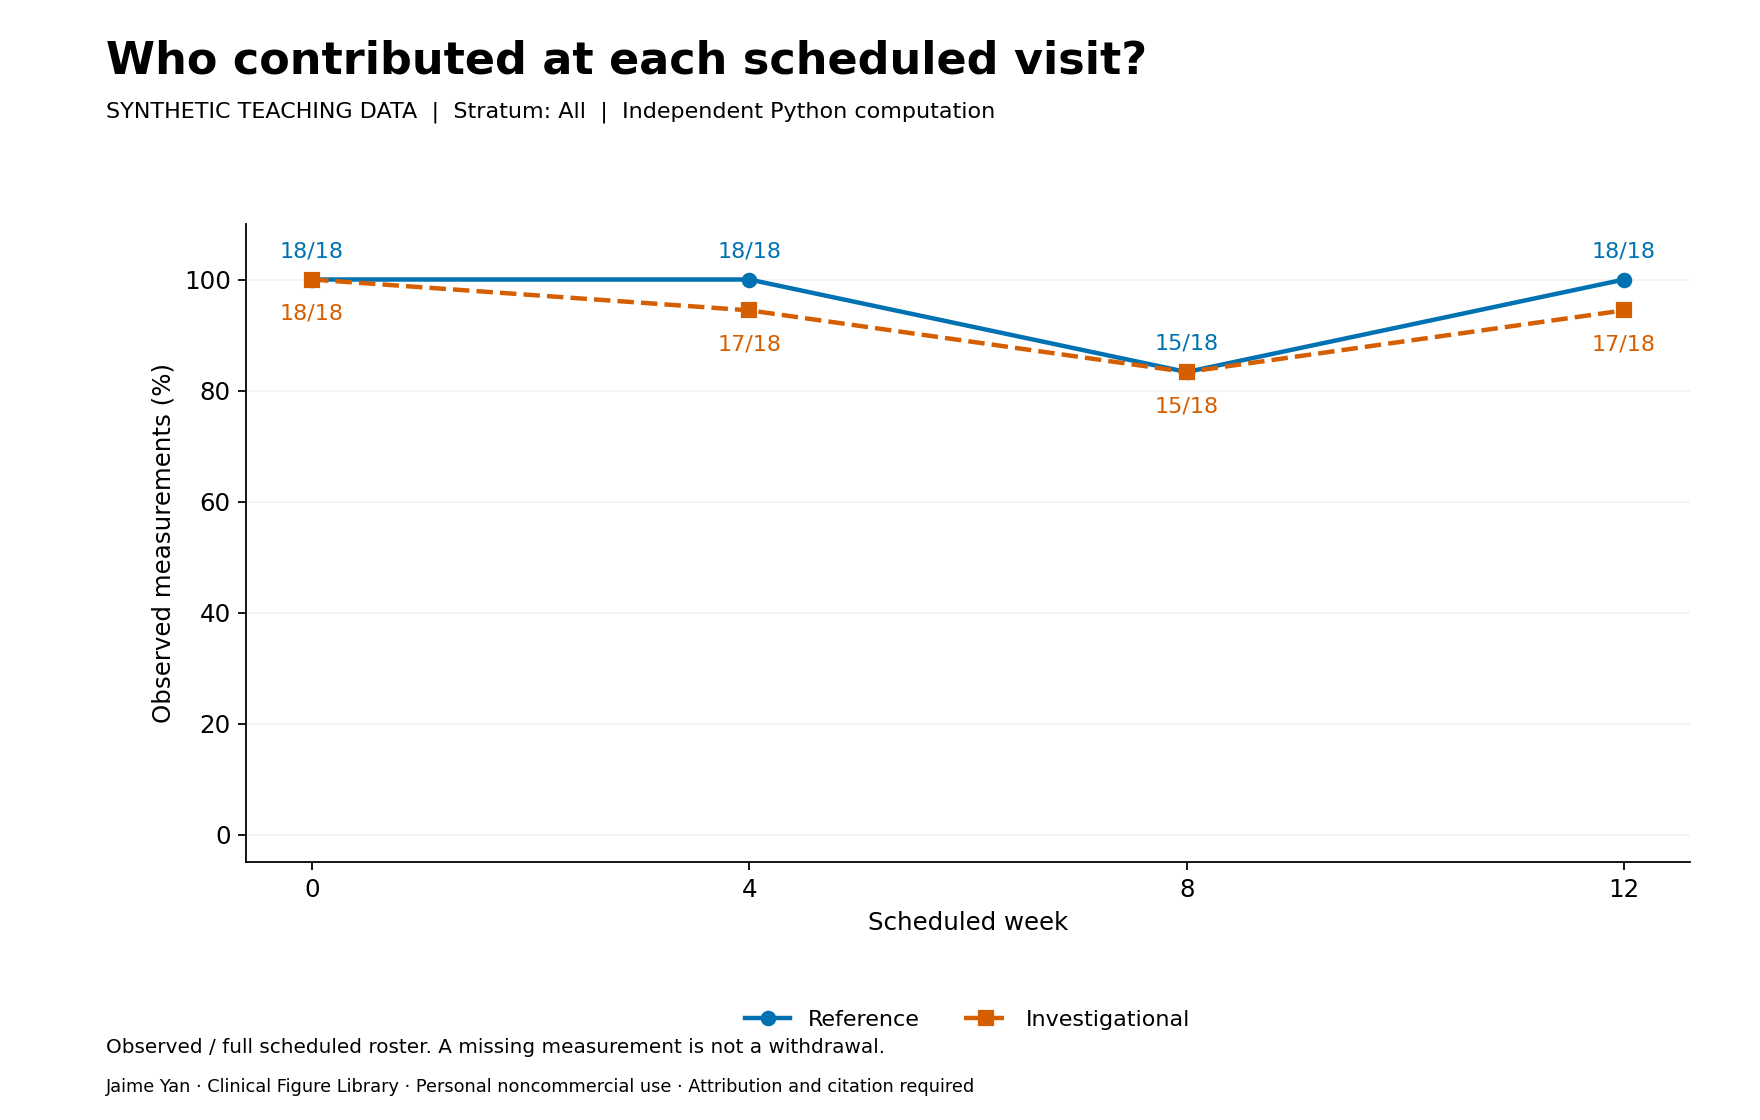
Values behind this selection
The table scrolls within this panel. All computed rows are included in the current-selection CSV and JSON.
Display rounded to three decimals. Downloaded CSV/JSON retains analysis precision. “Unavailable” is not zero.
| Population | Treatment arm | Week | Observed n | Scheduled roster N | Missing n | Observed (%) |
|---|---|---|---|---|---|---|
| All | Reference | 0 | 18 | 18 | 0 | 100 |
| All | Reference | 4 | 18 | 18 | 0 | 100 |
| All | Reference | 8 | 15 | 18 | 3 | 83.333 |
| All | Reference | 12 | 18 | 18 | 0 | 100 |
| All | Investigational | 0 | 18 | 18 | 0 | 100 |
| All | Investigational | 4 | 17 | 18 | 1 | 94.444 |
| All | Investigational | 8 | 15 | 18 | 3 | 83.333 |
| All | Investigational | 12 | 17 | 18 | 1 | 94.444 |
Why this figure, and what it estimates
Counts paired with a common 0–100% axis expose changing observed-case populations before interpreting individual trajectories. Every subject is scheduled at every visit in this example.
Analysis contract
At weeks 0, 4, 8 and 12 count nonmissing diameter measurements and divide by the full selected arm roster. Retain missing scheduled rows. This is a descriptive roster census, with no confidence interval, imputation, survival risk set or dropout estimator.
Assigned fictional arms; baseline = scheduled Week 0. No visit windows or treatment switching. Subjects are independent; domain scores are invented 0–100 points. Missing outcomes stay missing; missing scheduled rows are rejected.
Full input, units, missingness, interval, rounding and tolerance specification
Do not overinterpret
Missing measurements are not withdrawals. Completeness can recover at a later visit. For staggered enrollment, death or visits not yet due, introduce eligibility states before reusing this denominator. The display does not diagnose or correct missing-data bias.
Alternative views
A subject-by-visit matrix reveals which individuals are missing; a disposition table answers reasons for leaving. Neither is interchangeable with observed measurement counts.
Read, reproduce, then adapt
Four-step review guide · Compare complementary figures
Compare Week 8 and Week 12. Reconcile observed + missing = expected in the CSV for every row. Explain why a cumulative dropout curve could not correctly represent these measurements.
- Open the selected CSV and reconcile counts before comparing outcomes.
- Run the minimal example locally, then inspect the native Figure or ggplot object.
- For your own authorized data, explicitly map subject, arm, scheduled time and units. Keep expected missing visits as rows, document exclusions, and revise the contract for your trial design.
- Run invalid-input and known-answer checks before comparing R/Python outputs.
Executed source and separate QC layers
Original author: Jaime Yan. Personal noncommercial use only. License · Required citation · Upstream attribution
Python reusable implementation · R reusable implementation · Complete reproducible source bundle
Extract the complete bundle and run these commands from its root. Recorded environments: Python · R.
python examples/extensions.py completion All
Rscript --vanilla examples/extensions.R completion All
python scripts/render_extensions.py
Rscript --vanilla scripts/render_extensions.R
Rscript --vanilla scripts/verify_extensions.R
python scripts/verify_extensions.py- Numerical validation
- 670 values across three templates; max absolute difference 5.329e-14. Tolerance 1e-9 absolute/relative; counts exact.
- Data QC
- Keys, schedules, units, finite ranges, empty and sparse populations tested.
- Export QC
- CSV/JSON selection, parsed SVG, PNG dimensions, readable PDF text and Python text bounds checked.
- Package-risk assessment
- Not run. Numerical agreement is not package-risk or regulatory validation.
- Browser evidence
- Recorded separately in the local delivery report; no accessibility certification claimed.
Machine-readable numerical QC · Source, input and artifact hashes
Input: the library's original synthetic generator, seed 20260921, 36 fictional participants. Separate from CDISC Pilot. The deterministic missingness mechanism is described in the contract. No patient or employer records.