Figure Library / Learning paths
Beyond the mean · Synthetic teaching data
Distribution of symptom change
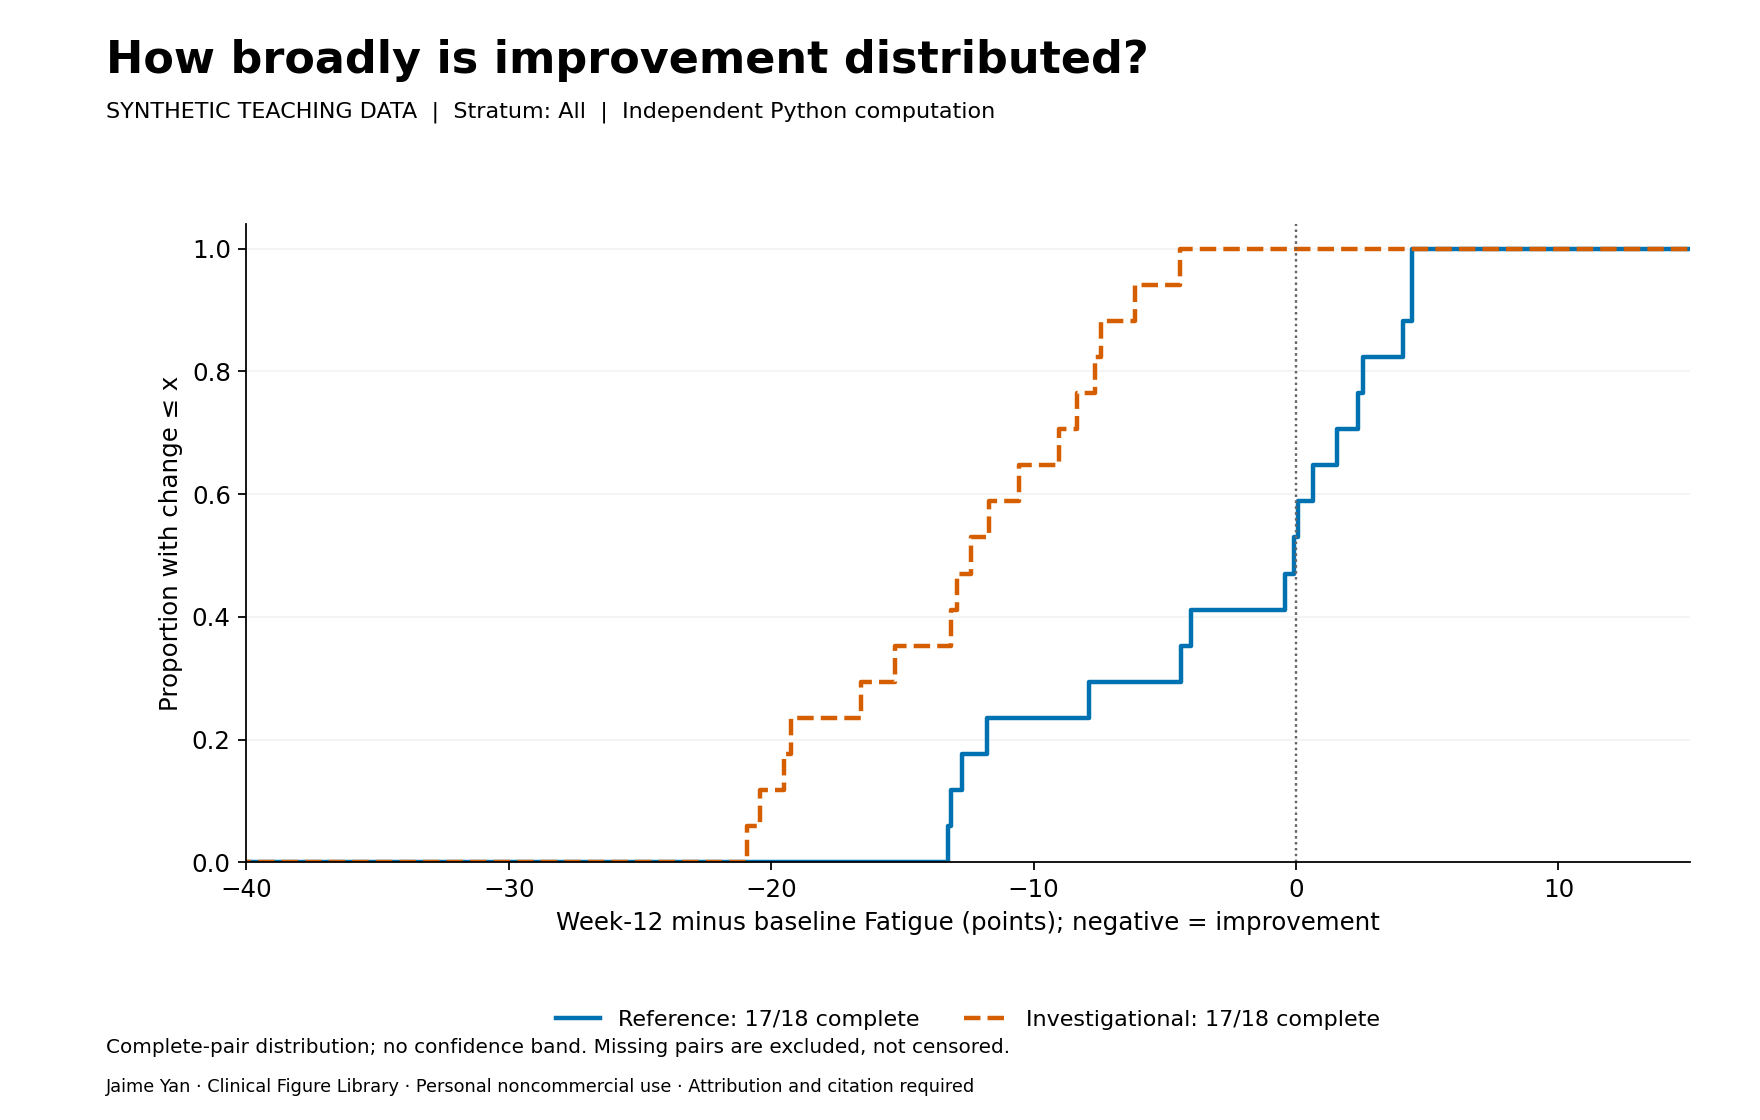
Is the observed improvement broadly distributed, or concentrated in a few participants?
Adds the full change distribution and explicit excluded-pair counts to the existing mean-based forest template.
Explore the executed results
Selection switches exact precomputed results. It changes the figure, denominators, table, summary and current-selection downloads together. No analysis runs in this browser.
Python · All participants · 34 computed rows. Review population counts and exact values in the table below.
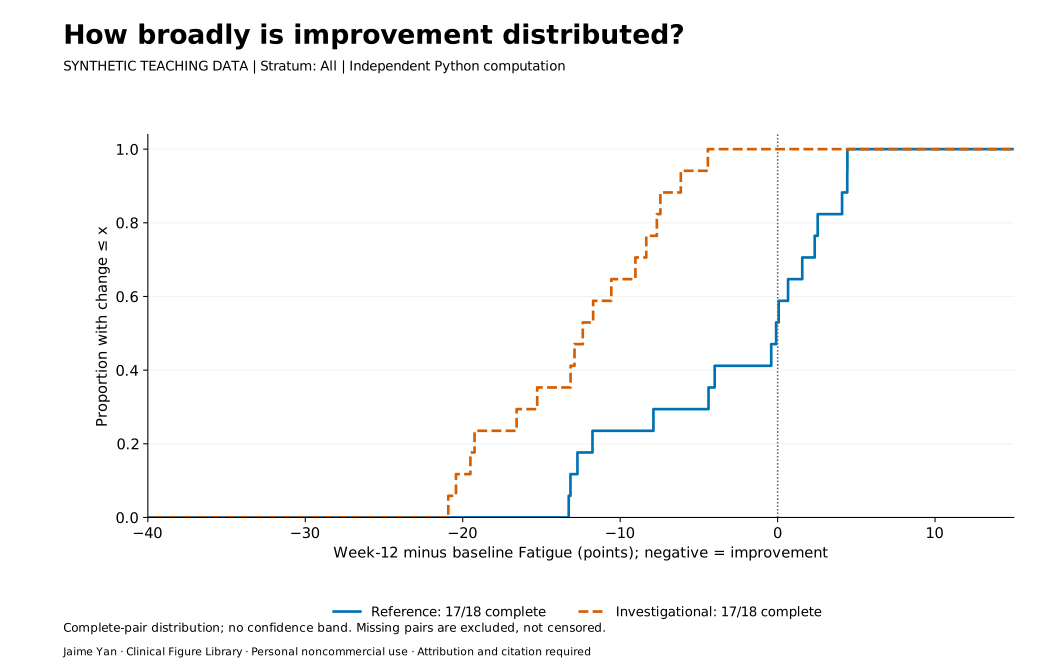
Image unavailable. Use the numerical table and downloads below.
Values behind this selection
The table scrolls within this panel. All computed rows are included in the current-selection CSV and JSON.
Display rounded to three decimals. Downloaded CSV/JSON retains analysis precision. “Unavailable” is not zero.
| Population | Treatment arm | Symptom domain | Complete pairs n | Scheduled roster N | Missing n | Change (points) | Cumulative proportion |
|---|---|---|---|---|---|---|---|
| All | Reference | Fatigue | 17 | 18 | 1 | -13.268 | 0.059 |
| All | Reference | Fatigue | 17 | 18 | 1 | -13.156 | 0.118 |
| All | Reference | Fatigue | 17 | 18 | 1 | -12.713 | 0.176 |
| All | Reference | Fatigue | 17 | 18 | 1 | -11.758 | 0.235 |
| All | Reference | Fatigue | 17 | 18 | 1 | -7.887 | 0.294 |
| All | Reference | Fatigue | 17 | 18 | 1 | -4.386 | 0.353 |
| All | Reference | Fatigue | 17 | 18 | 1 | -3.996 | 0.412 |
| All | Reference | Fatigue | 17 | 18 | 1 | -0.406 | 0.471 |
| All | Reference | Fatigue | 17 | 18 | 1 | -0.094 | 0.529 |
| All | Reference | Fatigue | 17 | 18 | 1 | 0.069 | 0.588 |
| All | Reference | Fatigue | 17 | 18 | 1 | 0.665 | 0.647 |
| All | Reference | Fatigue | 17 | 18 | 1 | 1.566 | 0.706 |
| All | Reference | Fatigue | 17 | 18 | 1 | 2.357 | 0.765 |
| All | Reference | Fatigue | 17 | 18 | 1 | 2.547 | 0.824 |
| All | Reference | Fatigue | 17 | 18 | 1 | 4.095 | 0.882 |
| All | Reference | Fatigue | 17 | 18 | 1 | 4.423 | 0.941 |
| All | Reference | Fatigue | 17 | 18 | 1 | 4.433 | 1 |
| All | Investigational | Fatigue | 17 | 18 | 1 | -20.917 | 0.059 |
| All | Investigational | Fatigue | 17 | 18 | 1 | -20.427 | 0.118 |
| All | Investigational | Fatigue | 17 | 18 | 1 | -19.512 | 0.176 |
| All | Investigational | Fatigue | 17 | 18 | 1 | -19.248 | 0.235 |
| All | Investigational | Fatigue | 17 | 18 | 1 | -16.576 | 0.294 |
| All | Investigational | Fatigue | 17 | 18 | 1 | -15.269 | 0.353 |
| All | Investigational | Fatigue | 17 | 18 | 1 | -13.149 | 0.412 |
| All | Investigational | Fatigue | 17 | 18 | 1 | -12.900 | 0.471 |
| All | Investigational | Fatigue | 17 | 18 | 1 | -12.373 | 0.529 |
| All | Investigational | Fatigue | 17 | 18 | 1 | -11.715 | 0.588 |
| All | Investigational | Fatigue | 17 | 18 | 1 | -10.564 | 0.647 |
| All | Investigational | Fatigue | 17 | 18 | 1 | -9.032 | 0.706 |
| All | Investigational | Fatigue | 17 | 18 | 1 | -8.341 | 0.765 |
| All | Investigational | Fatigue | 17 | 18 | 1 | -7.669 | 0.824 |
| All | Investigational | Fatigue | 17 | 18 | 1 | -7.445 | 0.882 |
| All | Investigational | Fatigue | 17 | 18 | 1 | -6.147 | 0.941 |
| All | Investigational | Fatigue | 17 | 18 | 1 | -4.429 | 1 |
Why this figure, and what it estimates
An empirical cumulative distribution keeps every complete-pair change without histogram bins or a density bandwidth. At any x, read the fraction whose change is at most x. Negative values mean less burden on this invented scale.
Analysis contract
Week-12 minus baseline Fatigue, among complete pairs in each arm and selected sex stratum. SciPy stats.ecdf and R stats::ecdf are run independently. Ties share a jump. No confidence band, imputation, censoring adjustment or multiplicity claim.
Assigned fictional arms; baseline = scheduled Week 0. No visit windows or treatment switching. Subjects are independent; domain scores are invented 0–100 points. Missing outcomes stay missing; missing scheduled rows are rejected.
Full input, units, missingness, interval, rounding and tolerance specification
Do not overinterpret
This describes observed complete pairs, not the randomized-population treatment effect. Missing pairs are not censored observations. A taller curve at a negative threshold does not establish clinical benefit or significance.
Alternative views
Use an adjusted mean treatment contrast for inference; use a quantile plot to emphasize the middle and tails. A histogram may be more familiar but depends on bins.
Read, reproduce, then adapt
Four-step review guide · Compare complementary figures
Select Female, then inspect complete-pair and roster counts. At change zero, count the exported raw pairs with change <= 0 and divide by the complete-pair n. Explain why the answer cannot be called a responder rate without a prespecified meaningful threshold.
- Open the selected CSV and reconcile counts before comparing outcomes.
- Run the minimal example locally, then inspect the native Figure or ggplot object.
- For your own authorized data, explicitly map subject, arm, scheduled time and units. Keep expected missing visits as rows, document exclusions, and revise the contract for your trial design.
- Run invalid-input and known-answer checks before comparing R/Python outputs.
Executed source and separate QC layers
Original author: Jaime Yan. Personal noncommercial use only. License · Required citation · Upstream attribution
Python reusable implementation · R reusable implementation · Complete reproducible source bundle
Extract the complete bundle and run these commands from its root. Recorded environments: Python · R.
python examples/extensions.py ecdf All
Rscript --vanilla examples/extensions.R ecdf All
python scripts/render_extensions.py
Rscript --vanilla scripts/render_extensions.R
Rscript --vanilla scripts/verify_extensions.R
python scripts/verify_extensions.py- Numerical validation
- 670 values across three templates; max absolute difference 5.329e-14. Tolerance 1e-9 absolute/relative; counts exact.
- Data QC
- Keys, schedules, units, finite ranges, empty and sparse populations tested.
- Export QC
- CSV/JSON selection, parsed SVG, PNG dimensions, readable PDF text and Python text bounds checked.
- Package-risk assessment
- Not run. Numerical agreement is not package-risk or regulatory validation.
- Browser evidence
- Recorded separately in the local delivery report; no accessibility certification claimed.
Machine-readable numerical QC · Source, input and artifact hashes
Input: the library's original synthetic generator, seed 20260921, 36 fictional participants. Separate from CDISC Pilot. The deterministic missingness mechanism is described in the contract. No patient or employer records.