Clinical Data Lab · by Jaime Yan
Clinical questions.
Inspectable answers.
Follow the evidence from a clinical question to a result you can explore, reproduce and check.
One study. Seven perspectives.
Start anywhere. Every case includes data, code, results, methods and QC.
Who entered the study?
Read the starting point before reading the treatment effect.
Explore case →Where did participants leave?
A reconciled study flow, with reasons behind the losses.
Explore case →How did cognition change?
Observed ADAS-Cog trajectories, with the changing sample size in view.
Explore case →What safety signals emerge?
Subject incidence and event frequency, kept deliberately distinct.
Explore case →Did ALT shift out of range?
A baseline-to-end-of-treatment shift table with an explicit paired denominator.
Explore case →How stable is the contrast?
Unadjusted Week 24 contrasts that show their uncertainty.
Explore case →When did the first event occur?
Kaplan–Meier event-free curves, censor marks and numbers at risk.
Explore case →Clinical Figure Library
Explore the craft behind the figure.
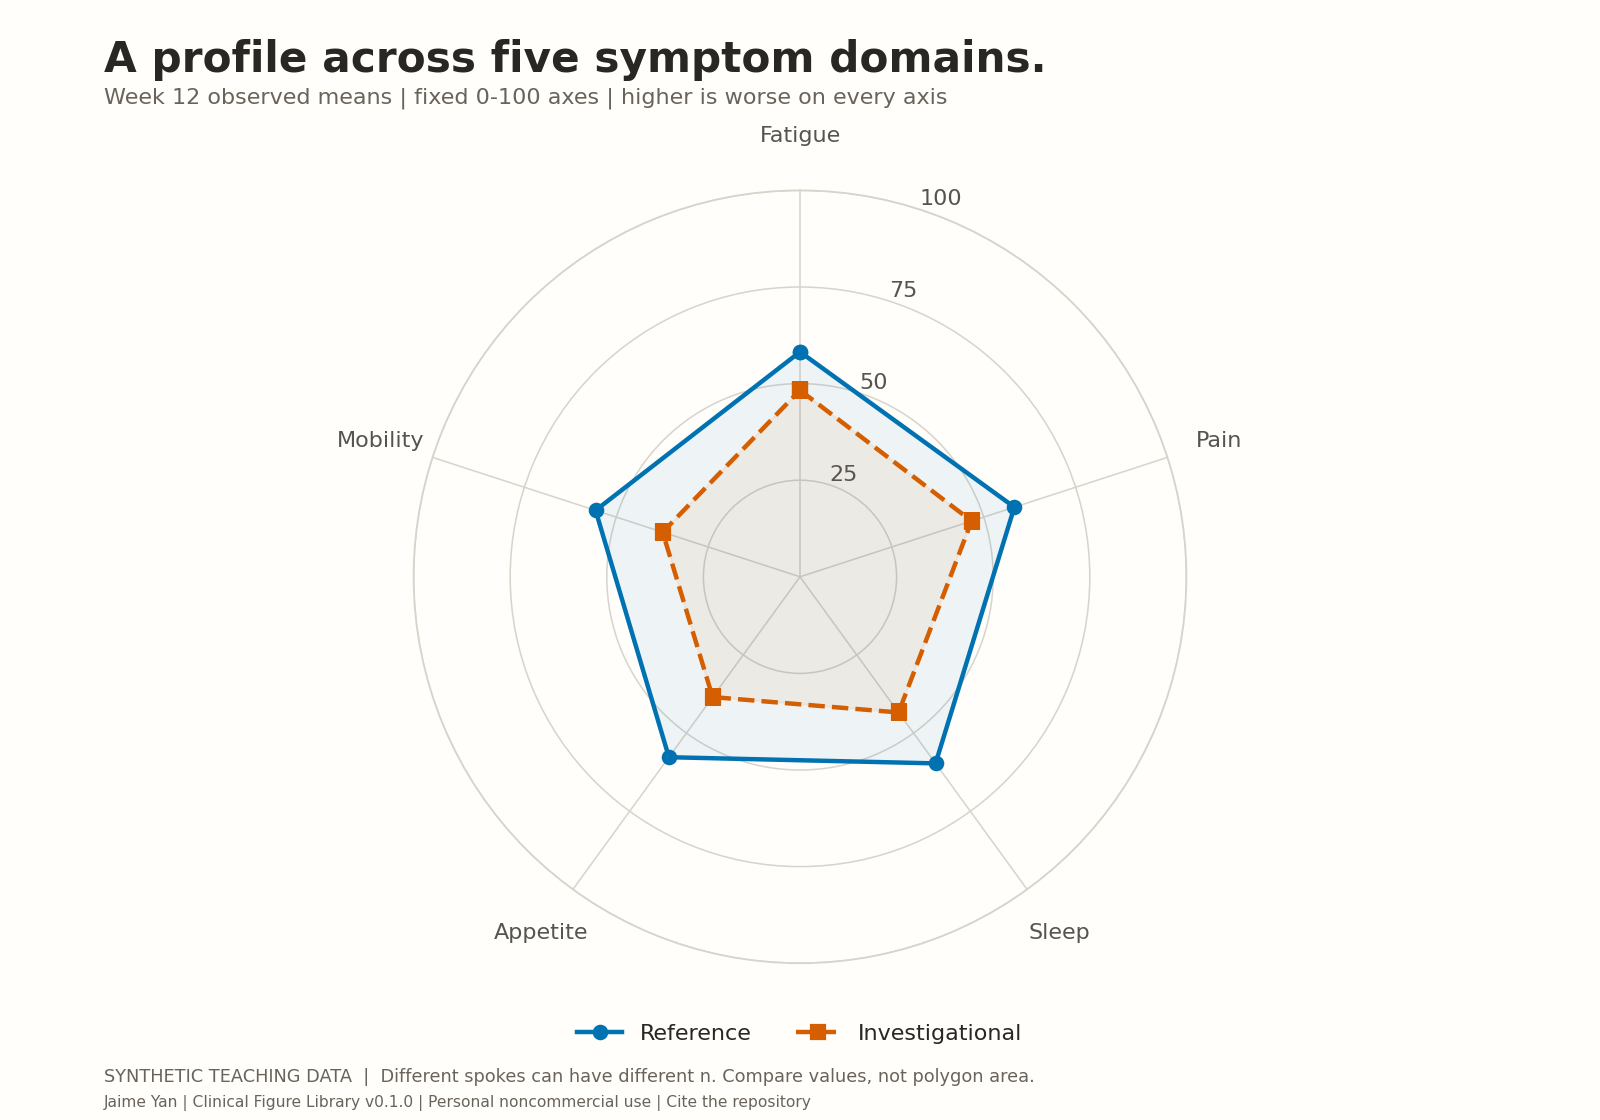
Six foundational figures and five analysis cases, including individual missingness patterns and baseline-adjusted comparisons. Independent R/Python, reusable source and vector exports. These fictional teaching data are separate from the CDISC Pilot cases above.
Open all figure templates →