You’re scoping a Phase III study. That’s 200–500 TLFs, independent double programming costing 1.6–2.0× the primary programming effort, and refinement cycles that stretch timelines by 20–40%. Someone on the team says: “We should automate this — everyone says pharmaverse cuts development time by a quarter.”
Do you believe the number? That question pushed me into a scoping review of the 2020–2025 literature on automating clinical trial statistical programming — TLF generation, validation frameworks, and AI/ML integration — reported per PRISMA-ScR with GRADE evidence ratings. The answer is more uncomfortable than the conference talks suggest.
TL;DR — The efficiency gains everyone quotes (15–25% for pharmaverse tooling, 30–50% for risk-based validation) are real but rest on Low to Very Low grade evidence: before/after comparisons, case reports, expert opinion. Only 12 of 527 validation papers report quantitative outcomes, and no RCT comparing validation approaches exists. Adopt the tools, but quote the numbers with the grade attached.
From 1,247 records to 42 numbers
The review screened 1,247 records and included 262 publications. Of those, only 42 (16%) reported quantitative outcomes at all. The rest are architecture descriptions, position papers, and experience reports — useful, but not evidence you can take to a resourcing discussion.
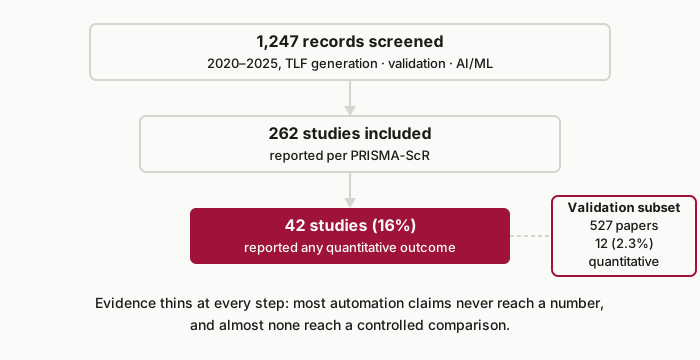
Figure 1: The evidence funnel. Each stage of the review thins the pool; quantitative validation data is the rarest commodity in the literature.
The gains are real, but the grades are not
Here is what the synthesis found, with the GRADE rating attached to each claim:
| Automation approach | Reported effect | GRADE | Evidence base |
|---|---|---|---|
| Pharmaverse TLF tooling (rtables, Tplyr, admiral) | 15–25% development-time reduction | Low | Case studies, before/after, no controls |
| Risk-based validation + CI/CD | 30–50% validation-effort reduction | Low | Observational comparisons |
| Metadata-driven architectures | 40–60% specification reuse | Very Low | Case reports, expert opinion |
| REDCap2SDTM | 75–85% SDTM conversion-time reduction (4–6 weeks → ~1 week) | Moderate | Strongest efficiency evidence in the review |
| Domain-specific LLMs (ClinicalBERT, GatorTron) | 88–93% F1 on clinical NLP benchmarks | Moderate | Controlled benchmark evaluations |
| General-purpose LLMs for code generation | 60–85% accuracy on routine tasks | Very Low | Heterogeneous, mostly uncontrolled |
Table 1: Claimed efficiency gains by automation approach, with GRADE evidence quality. Bigger claimed effects tend to come with weaker evidence.
Notice the pattern: the bigger the claimed effect, the weaker the evidence behind it. The workflow-efficiency numbers come from observational before/after comparisons. The controlled benchmark numbers sit in the AI/ML section, not in the workflow section your team quotes at planning meetings.
Validation: the most discussed, least measured topic
Validation dominated the literature — 36.5% of all topic mentions across 789 papers. Yet the meta-analytic pass over 527 validation-focused papers found only 12 (2.3%) with quantitative effectiveness data.
The single quantitative double-programming study reports 92–98% error detection at 1.6–2.0× effort — from 15 SAS programs, with no confidence intervals (GRADE: Very Low). The best evidence in the whole validation domain is hybrid ML+human review showing 45–49% time reduction, but those studies (COMPASS, n=7,611 events; NAVIGATE ESUS, n=5,390 events) measured event adjudication, not programming validation. And the number of RCTs comparing double programming against automated testing or risk-based approaches: zero.
A post-hoc power calculation shows why this won’t fix itself accidentally. Detecting a 10-percentage-point difference in error detection rates at 80% power needs roughly 200 programs per arm. The largest study available had 15.
A risk-based middle path
The review’s risk-based decision tree, aligned with ICH Q9, is the defensible middle path:
if output in (primary efficacy, key safety, labeling):
    double_program()          # high risk: full independent QC
elif uses_novel_methods:
    peer_review() + automated_tests()   # medium risk
else:
    automated_tests()         # low risk: snapshot/unit tests
    document_and_archive()
Listing 1: Risk-based validation decision tree. Effort concentrates where an error would hurt a submission.
Reported effect: 25–45% validation-effort reduction — again Low-grade evidence, but the direction is consistent across sources. Regulators accept the logic because FDA/EMA guidance (21 CFR Part 11, Annex 11, ICH E6(R3)) never prescribed a specific methodology in the first place.
For LLMs, the evidence supports exactly one posture: assistant, not author. Code generation at 60–85% accuracy (Very Low grade), 5–15% hallucination rates in clinical contexts, and real-world deployment success rates of 26–65% mean every AI-drafted line goes through the same validation pipeline as human code. Treat it as a fast first draft.
Honest limitations
The review is upfront about what it couldn’t do. Reported ranges are observed variation across studies, not confidence intervals. Outcome definitions (“error detection rate” vs. “confirmation rate” vs. “discrepancy rate”) were too heterogeneous to pool. Publication bias is likely — successful implementations get written up, failed ones don’t. Most efficiency case studies are single-organization (n=1) reports where tool effects are confounded with learning curves and concurrent process changes. And the platform adoption figures (SAS 95%, R 60%, Python 70%) are literature-synthesis estimates, not survey data.
Key takeaways
- Automation in statistical programming has reached practical maturity — the tools work and regulators accept them; what hasn’t matured is the evidence behind the efficiency claims.
- Quote every efficiency number with its GRADE rating: 15–25% (Low) for pharmaverse tooling, 30–50% (Low) for risk-based validation, 75–85% (Moderate) for REDCap2SDTM.
- Validation is the field’s biggest blind spot: 36.5% of the discussion, 2.3% of the quantitative data, zero RCTs.
- A risk-based validation strategy (double programming for high-risk outputs, automated tests for low-risk ones) is the defensible middle path regulators already accept.
- Use LLMs as assistants, not authors — 60–85% code-generation accuracy and 5–15% hallucination rates mean AI output enters the same validation pipeline as human code.
Automation’s practical maturity is proven — five successful R Consortium pilot submissions (2021–2024) show the path works. But the field is making validation-strategy decisions on expert opinion and tradition, and the review’s most urgent research priority (severity score 100/100) is an RCT comparing validation approaches. Until that exists, build your own quantitative baseline as you adopt — right now almost nobody is publishing one.
The full synthesis — PRISMA flow, GRADE tables, forest plots, and the severity-scored research-gap list — is in the full paper, posted as a medRxiv preprint.